The Ridgewood Market Report
Village of Ridgewood, Bergen County, New Jersey
Data through August 29, 2026 · Version 1.0
Ashish Desai, REALTOR® · Keller Williams Town Life Realty · NJ License #2672398 201-790-4664 · ashish@ashishdesaigroup.com · ashishdesaigroup.com 82 N Summit Street, 2nd Floor, Tenafly, NJ 07670
1. Ridgewood in 2026: What This Report Tells You
Ridgewood is one of the strongest housing markets in Bergen County, and it has been for six straight years. The median home sold for $890,000 in 2021 and $1.46 million in the first eight months of 2026. Homes go under contract in about eleven days. Three out of four sell above the asking price. Nothing in the data suggests that is about to change: there are fewer homes for sale in the Village today than at any point in this period, and demand has not thinned.
That is good news if you own here. It is also good news if you want to buy here, provided you understand how the market actually works, because a Ridgewood purchase rewards preparation more than almost any town in the county. This report exists to give you that preparation. It contains the things a listing site cannot tell you, and it is free.
If you are buying
Come prepared to compete, and know exactly where the competition is. Between $800,000 and $2.5 million, which is most of the market, buyers paid 11 to 13 percent over asking in the last twenty months, and an offer at the list price rarely wins. Above $2.5 million and below $800,000, the picture is different: homes sell close to asking and there is room to negotiate. Section 4 gives you the numbers by price band so you can walk in knowing what a winning offer looks like at your budget, and what it does not need to look like.
Timing is worth real money. Offers written in spring face the most competition; offers written in late autumn face the least. The spread between the best and worst months is more than 12 points of asking price. On a $1.2 million home that is roughly $150,000. Section 3 shows the calendar.
Speed is the skill. A typical Ridgewood listing goes live midweek, holds a weekend open house and reviews offers on Monday or Tuesday. Pre-approval in hand, attorney identified, inspectors lined up: the buyers who win have all three done before they fall in love with a house. Section 4 walks through the eleven-day reality.
Know your true carrying cost, including the tax number nobody puts on the listing. The Village is completing its first full revaluation since 2008, effective for the 2027 tax year. For most recent buyers, the tax on the listing sheet understates what they will pay after the reset. Section 2 gives you a two-minute calculation to estimate your own number before you write an offer, and Section 6 gives you the right rate to model with. Buyers who do this math are not surprised in 2027; buyers who skip it often are.
Buy the house with its eyes open. Most Ridgewood homes were built before 1950, which is a large part of the Village’s appeal and a specific inspection agenda: oil tanks, original plumbing, older wiring, slate roofs. Section 12 tells you what to look for by the decade the house was built, which three specialist inspections matter most, and what the Village and the state require at closing. Section 16 covers the water bill, the lead-line program and the other costs that sit underneath the mortgage.
If you are selling
You are in the strongest seller’s position in the Village’s recent history, but the premium is not automatic. It depends on price band, on season and on presentation. The same tables that tell buyers where the competition is tell you where your listing will draw it. Section 3 and Section 5 show where the demand is concentrated and which segments move slowly, so you can price to the market you are actually in rather than the town-wide average.
Timing works for you too. Listing into the spring window captures the peak of buyer competition. Section 3 shows the month-by-month pattern.
Get ahead of the inspection. In a market where buyers routinely waive contingencies, a seller who has already swept for a tank, scoped the sewer line and documented the electrical removes the last reason for a buyer to hesitate. Section 12 lists what a Ridgewood buyer’s inspector will look for.
What a well-informed owner knows about the Village
The rest of the report is the context that makes those decisions easier, and it is where this report goes beyond anything a consumer site publishes.
Schools (Section 7) reports what the New Jersey Department of Education publishes about Ridgewood Public Schools: enrollment by school, proficiency results, AP participation and outcomes, graduation rates, teacher experience, per-pupil spending and the district budget. No third-party grades, just the state’s own data, so you can judge for yourself.
Taxes (Section 6) explains exactly what a Ridgewood tax bill is made of, how it compares with Glen Rock, Ho-Ho-Kus, Wyckoff, Midland Park and Paramus, and what is already in motion for 2027, including the relief programs available to owners who qualify.
Commute (Section 13) covers the train and bus service from Ridgewood station, the fare schedule, and the one thing every new commuter needs to know about station parking, with the phone number to call.
Zoning (Section 11) answers the question most buyers of an older home eventually ask: can I add on, put on a dormer, go up a story? It gives the rules for a typical lot, when a variance is required, and what the teardown-and-rebuild economics look like in the Village today.
Housing pipeline (Section 10) explains the state affordable-housing obligation in plain terms, what the Village has already built, and where the February 2026 zoning changes allow new construction downtown, so you know what is possible on the blocks near where you are buying.
Living here (Section 9) covers the downtown, Graydon Pool, the parks, the library, the farmers market, the annual calendar and the walking distance from each part of the Village to the station.
Crime and safety (Section 8) presents the reported figures for Ridgewood and four neighboring towns from FBI and state data, with the years and sources, and without commentary.
Neighborhoods (Section 14) profiles the five areas of the Village by what actually sold there, the age and size of the homes, and how each will be affected by the 2027 revaluation.
How Ridgewood compares (Section 18) puts the Village beside Glen Rock, Ho-Ho-Kus, Wyckoff, Midland Park and Paramus on price, taxes, schools, commute and water, one source per row. What your budget buys (Section 19) describes the typical home that sold at $1.0, $1.4 and $2.0 million. Your first 90 days (Section 20) is the owner’s calendar, and Section 21 adds up what a $1.4 million home costs to own, line by line.
Reasons not to buy here (Section 17) is included on purpose. Every town has trade-offs, and a buyer who has read them and still wants Ridgewood is the buyer who is happy here in five years.
How to use this report
Start with the one-page summary that follows. Read Sections 2, 3 and 4 before you look at a single house, Section 19 to see what your budget buys, and Section 12 before your first inspection. Bring the rest to the questions as they come up. Every figure is dated and sourced. The report is updated quarterly; the next edition covers data through November 2026.
What I tell my clients: Ridgewood is not a hard market to buy in. It is a hard market to buy in unprepared. The buyers I see win are not the ones with the most money. They are the ones who did the reading, knew their number, and were ready on Tuesday.
Ridgewood at a Glance
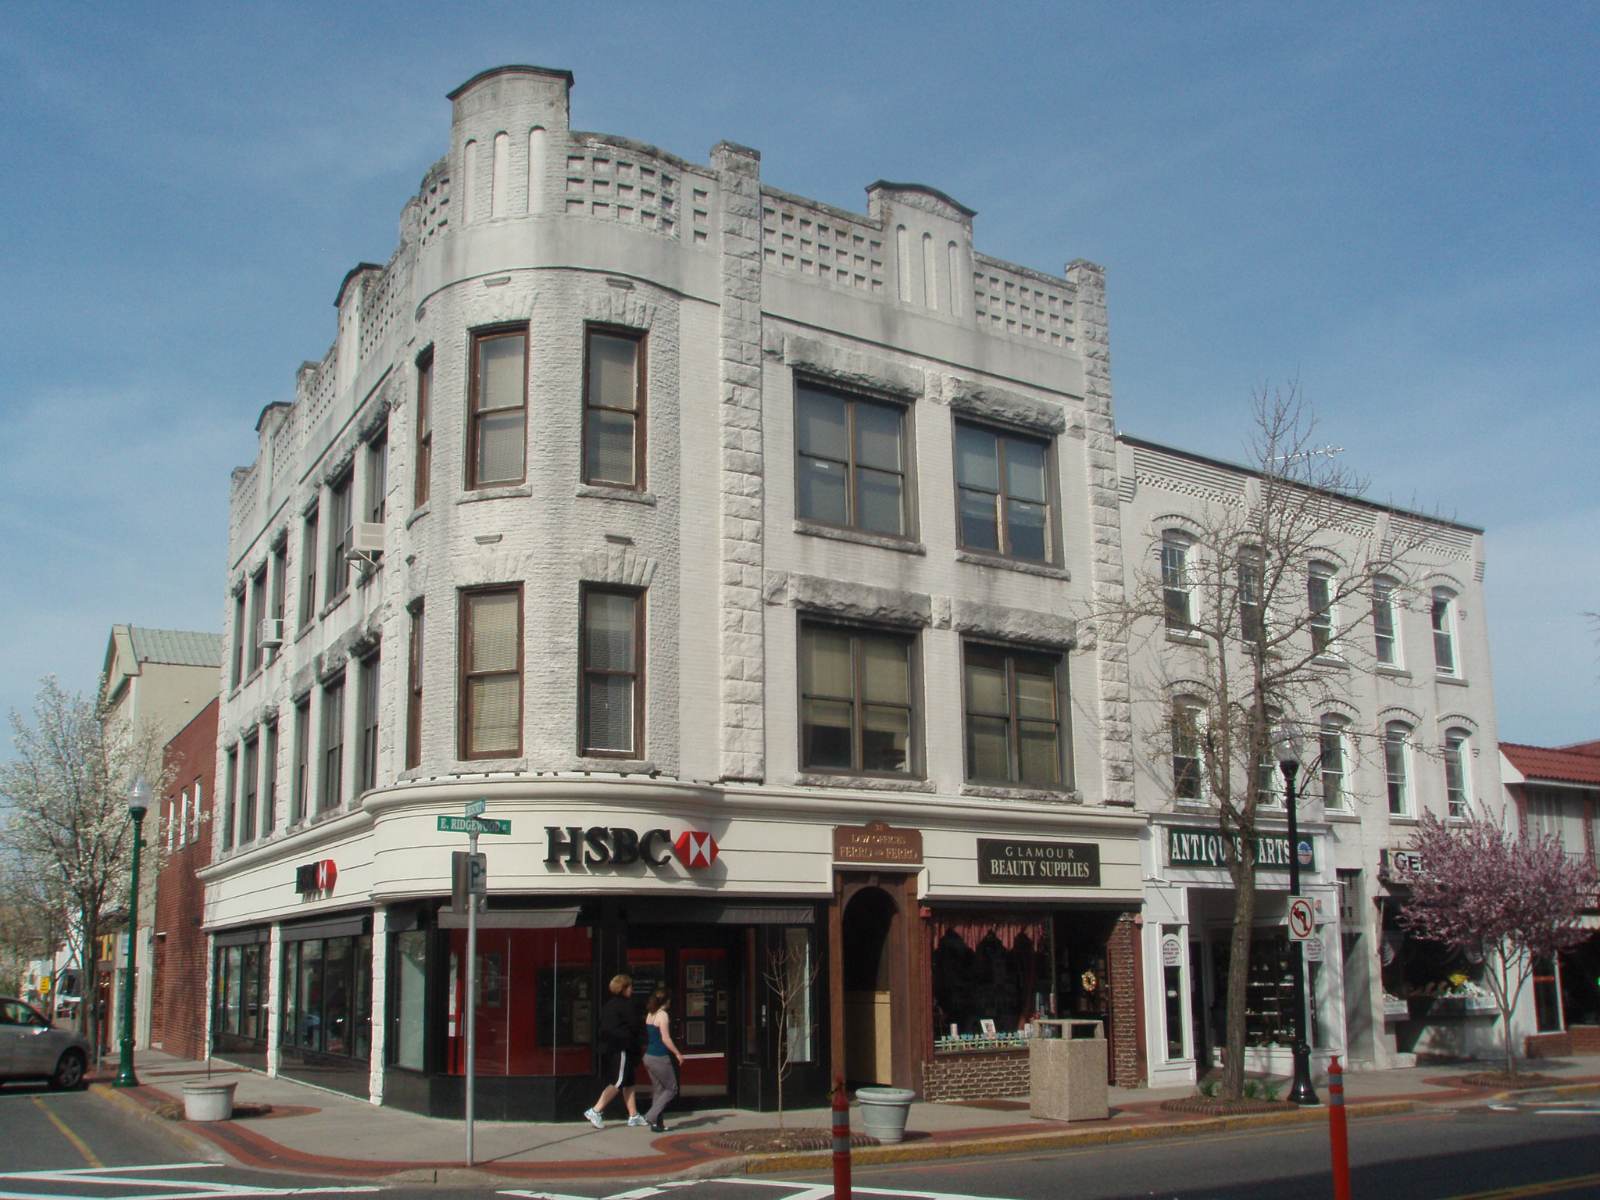
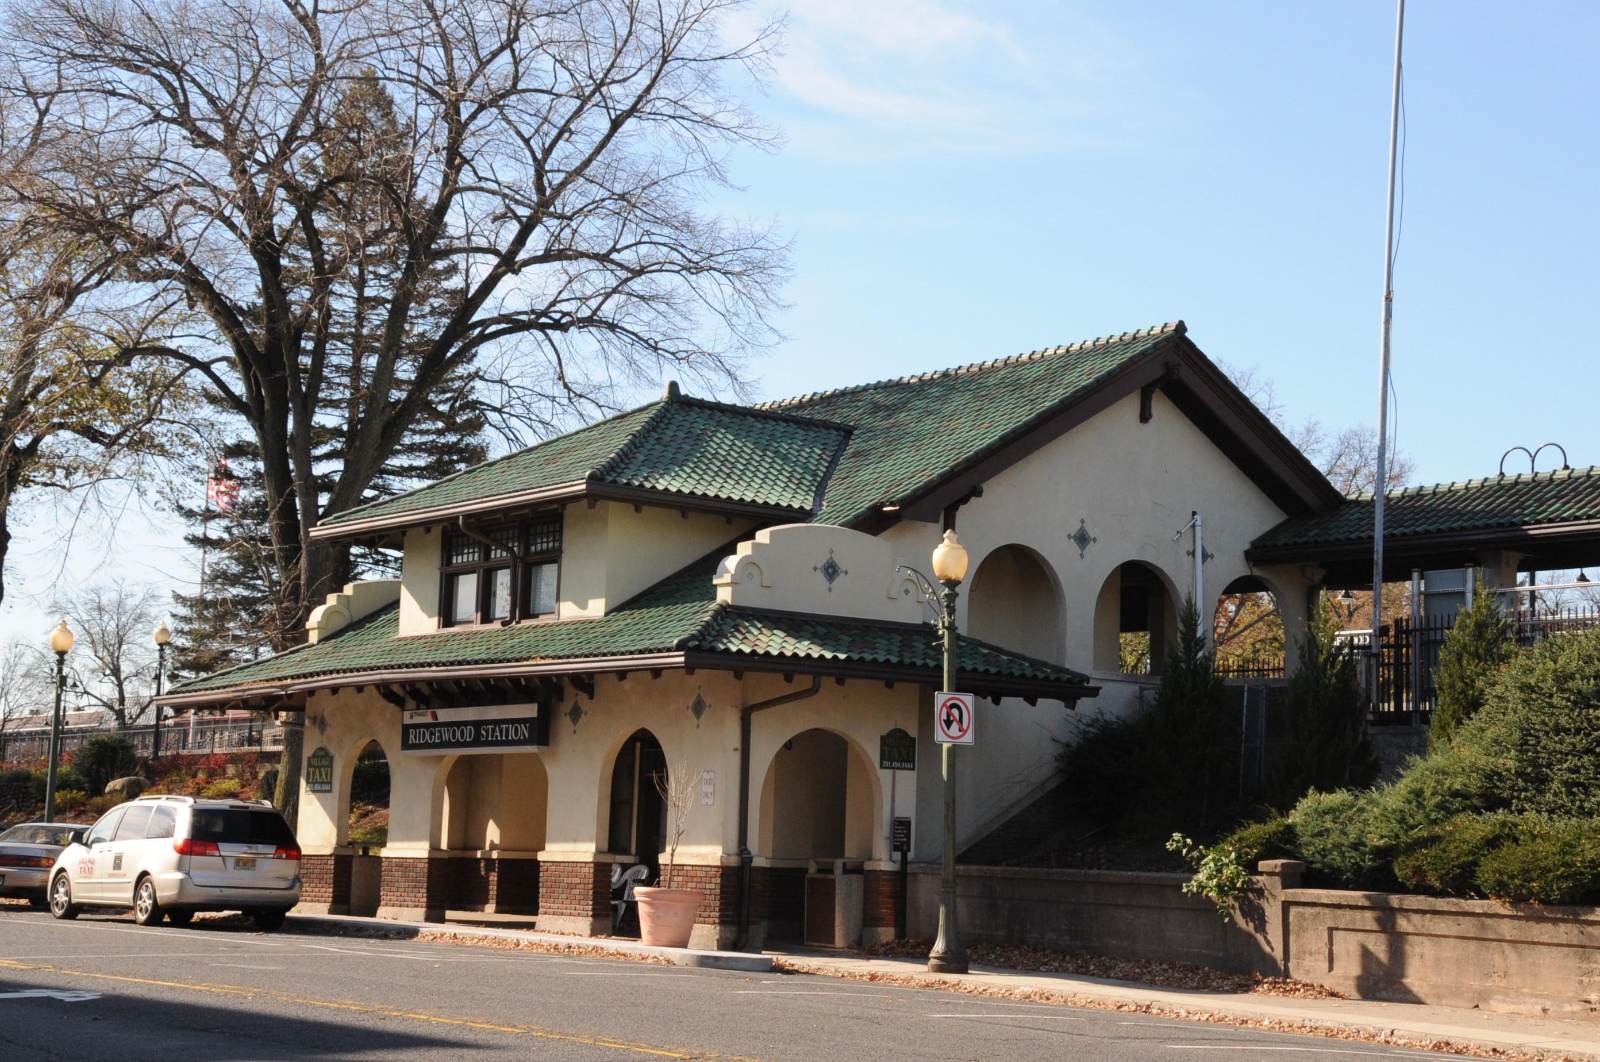
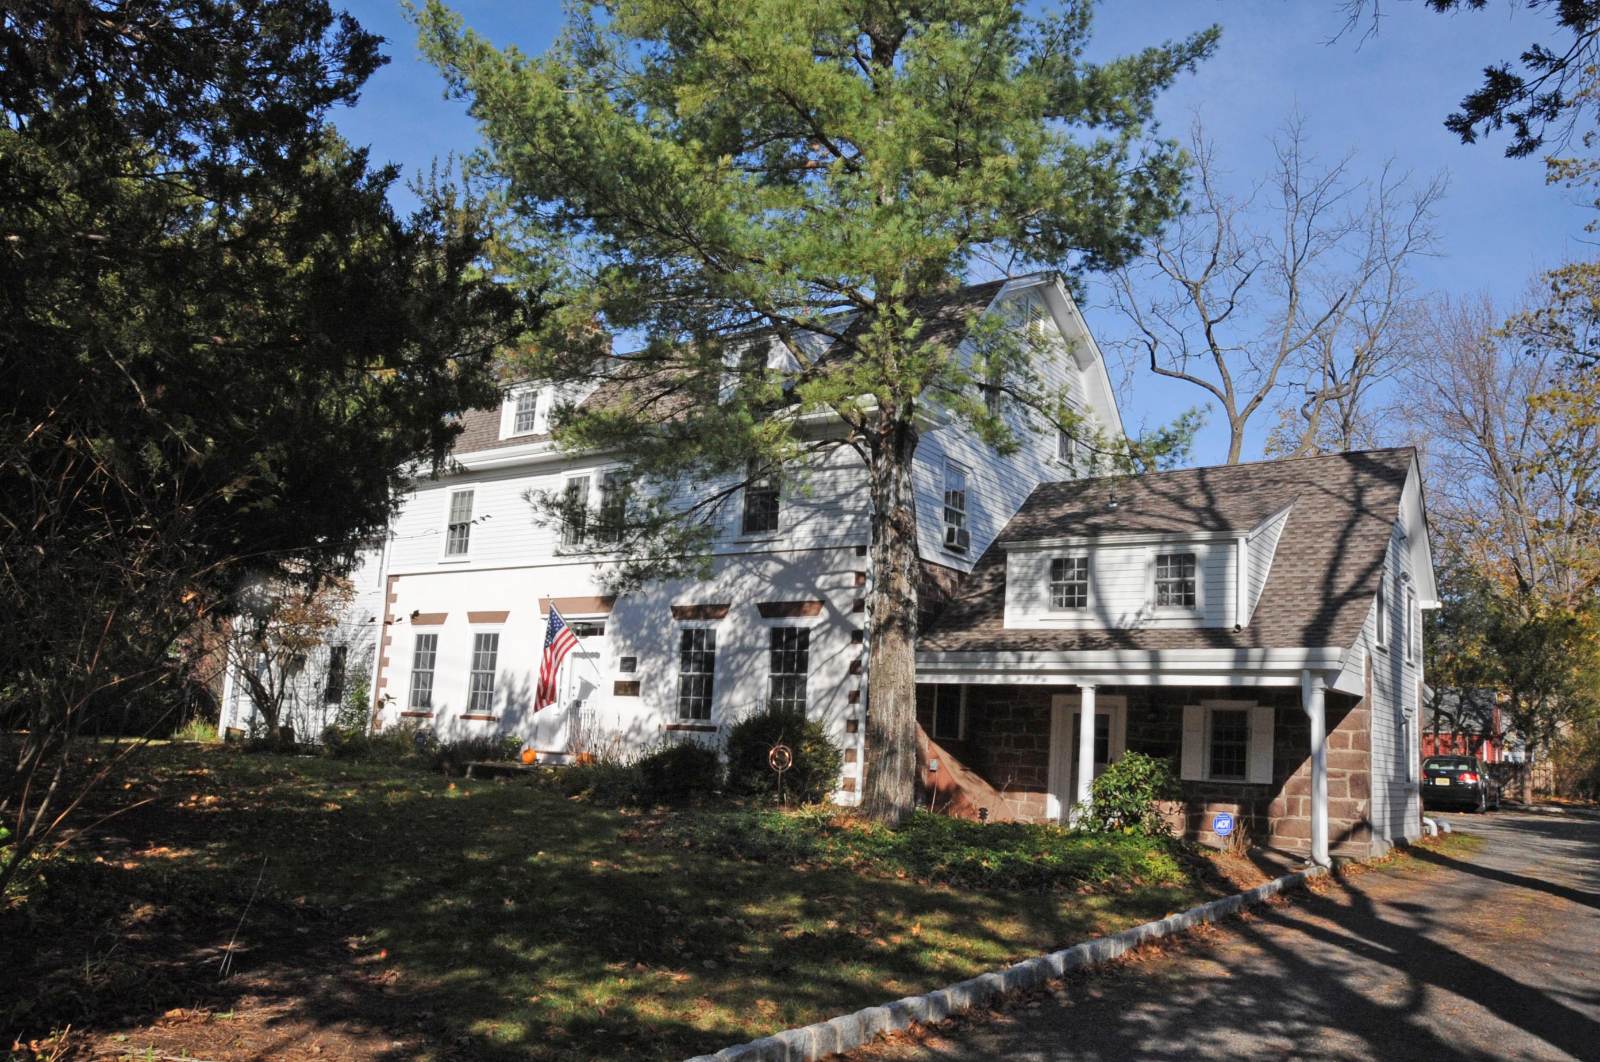
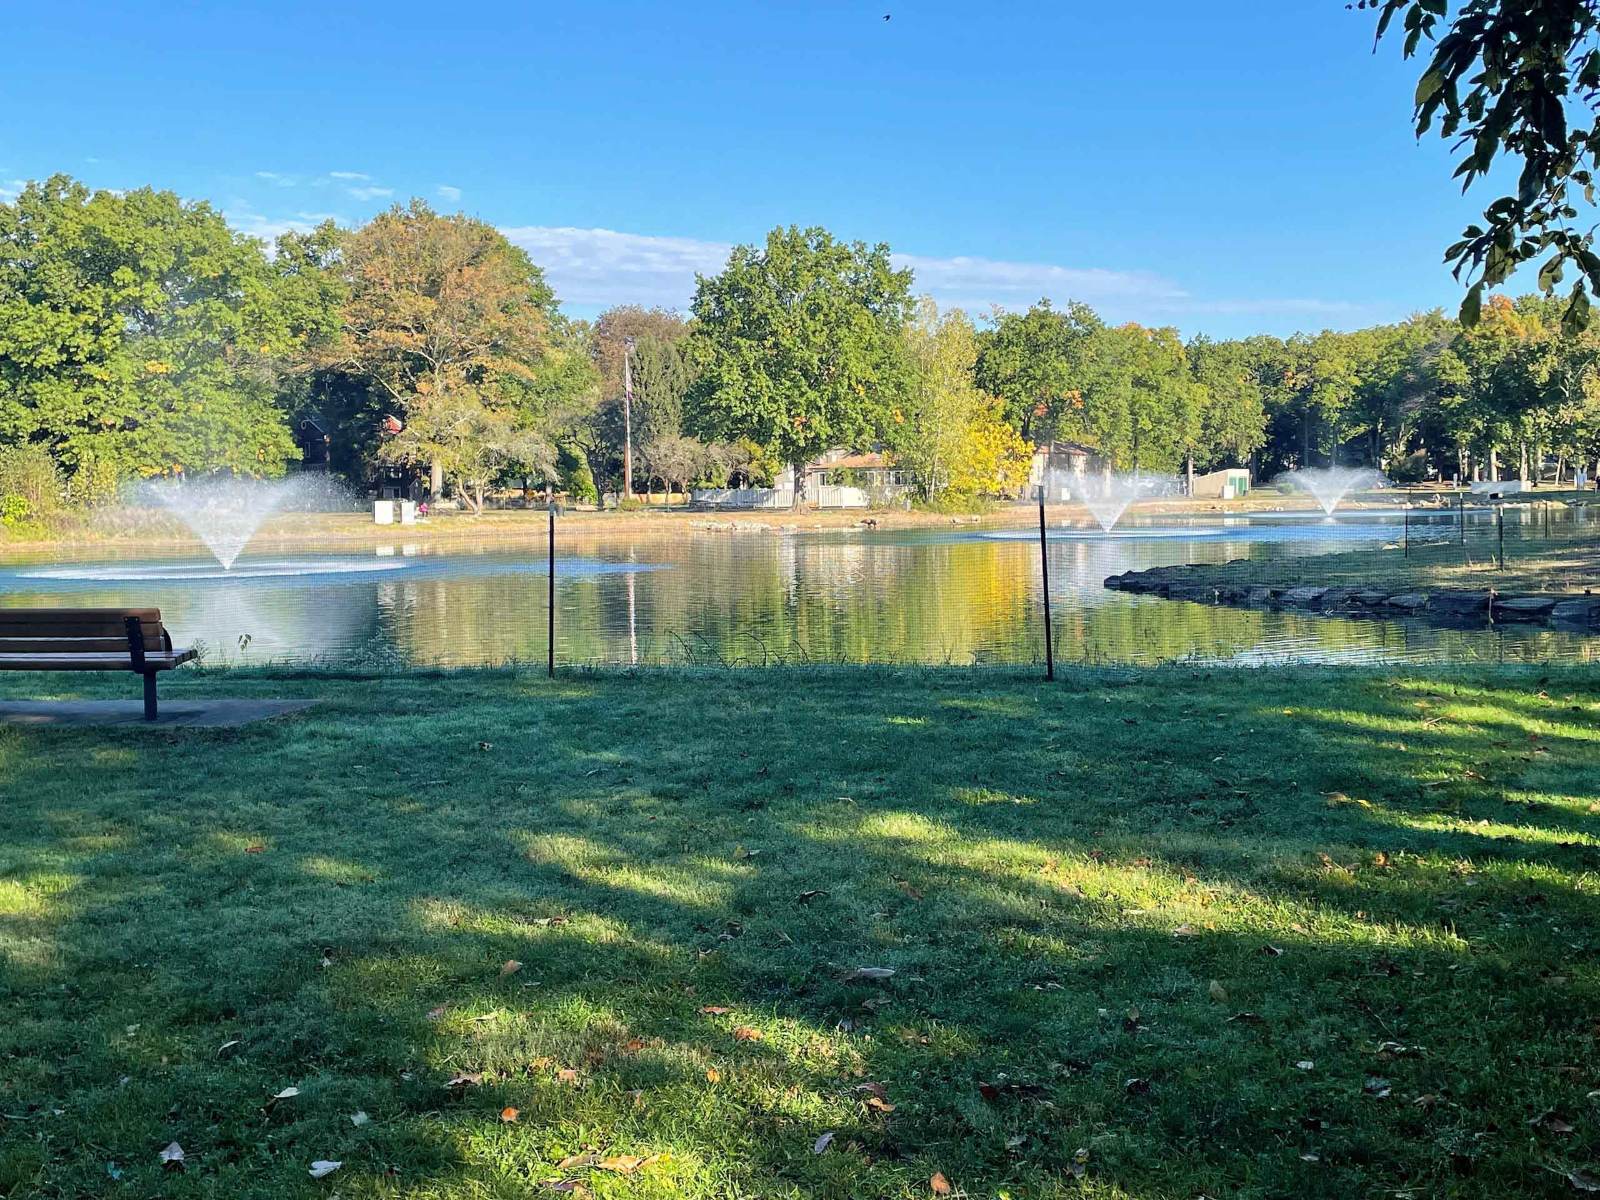
Three things to know before you look at a house.
Offers written in spring face the most competition and offers written in late autumn the least; the gap is worth about $150,000 on a $1.2 million home.
The tax on the listing sheet is the seller’s number. Most recent buyers will pay more after 2027.
Every train goes to Hoboken; Manhattan is a transfer at Secaucus or a PATH ride. Station parking is a Village permit, and availability is a phone call.
Sale figures from the New Jersey Multiple Listing Service through August 29, 2026; tax figures from the New Jersey Division of Taxation; population from the U.S. Census Bureau. Each figure is explained in the section that covers it. Photographs: East Ridgewood Avenue by Alexisrael (CC BY-SA 3.0); Ridgewood station and the Van Dien House by KLOTZPLATE (CC BY-SA 4.0), both via Wikimedia Commons; Wild Duck Pond courtesy of the Bergen County Department of Parks, Wild Duck Pond Ecological Restoration.
2. The 2027 Revaluation
If you buy a house in Ridgewood this year, the property tax figure on the listing sheet is not the tax you will pay.
The Village is currently conducting a revaluation of every taxable property, at the direction of the Bergen County Board of Taxation and the New Jersey Division of Taxation. Appraisal Systems, Inc., of Glen Rock has the contract. Notification letters went to property owners on March 20, 2026, and field inspectors are walking homes now, taking exterior measurements and, where owners permit, interior inspections. The new assessments take effect for the 2027 tax year.1
It is the first full revaluation since 2008. The Village reassessed in 2013 and has carried that roll, with only new-construction and appeal adjustments, for thirteen years.2
This matters more than it sounds like it should.
What a revaluation actually does
A revaluation does not raise taxes at the town level. The Village, the school district and the county decide how much money they need; the assessment roll only determines who pays which share of it. Reset every assessment to current market value and the total collected stays roughly the same, but the distribution shifts, sometimes sharply.
The shift depends on how far current assessments have drifted from what houses actually sell for, and that drift is measurable. New Jersey publishes an equalization ratio for every municipality each year, expressing assessed value as a percentage of true market value.
Ridgewood’s certified ratio for tax year 2026 is 60.52 percent.3
Assessments across the Village sit at roughly three-fifths of market value. The ratio was 86 percent as recently as tax year 2021; it has fallen 26 points in five years, which is the 2021 to 2026 price run in Section 3 expressed as an assessment statistic.4 That figure is an average, and the word matters: the whole reason a revaluation gets ordered is that the drift is uneven. Some homes are assessed at 75 percent of what they would sell for. Others at 45 percent. Under the current roll, the second owner is paying materially less than their share, and the first is subsidizing them.
The revaluation ends that. Every property resets to full market value, and the burden redistributes accordingly.
The rule of thumb
Compare your assessment to what your house would sell for today.
- Assessed below 60 percent of market value: expect your share to rise
- Assessed near 60 percent: expect roughly no change
- Assessed above 60 percent: expect relief
The bigger the gap in either direction, the bigger the move.
What recent buyers actually look like
This is not a hypothetical. The deed record answers it.
Every sale recorded in Ridgewood in 2025 and 2026 carries the current assessment and the price paid. Dividing one by the other for every home sale in that window gives exactly the ratio described above, for the people who bought most recently.5
| 2025 to 2026 buyers | Assessment as % of price paid |
|---|---|
| 10th percentile | 42.4% |
| 25th percentile | 46.9% |
| Median | 50.9% |
| 75th percentile | 56.8% |
| 90th percentile | 64.6% |
Seventy percent of recent buyers are assessed below 55 percent of what they paid. Eighty-three percent are below the Village ratio of 60.52 percent. Fewer than one in ten is above it.
Read that against the rule of thumb. The typical 2025 to 2026 buyer is assessed at 50.9 percent of price against a Village ratio of 60.52 percent. On the arithmetic of a revaluation, that buyer’s share of the levy rises by the ratio of the two, about 19 percent, before any budget growth. On the state’s average residential bill of $20,596, a 19 percent share increase is roughly $3,900 a year; on a house that closed at the 2026 median of $1,460,088, where the tax at the state’s effective rate is already about $28,400, it is roughly $5,400.6 The exact figure depends on the 2027 tax rate, which will itself fall as total assessed value rises. The direction is not in doubt.
The drift is not uniform across the Village. Section 14 reports the same ratio by census tract: 49.7 percent on the west side below the Heights (tract 472), 50.9 to 51.6 percent across the east, north and south (tracts 471, 474, 475), and 54.6 percent in the large-lot tract north of West Ridgewood Avenue (tract 473). The tract where the most expensive houses sit has drifted least.
Why this is urgent for buyers right now
Section 3 of this report documents that Ridgewood buyers in 2026 are paying a median of 111.2 percent of asking price. Homes are selling for more than they list for, consistently, across most of the market.
Those transactions are the evidence the revaluation will use.
A buyer who closes at $1.6 million on a home assessed at $950,000 has just created a public record establishing that the assessment is roughly 59 percent of market. When the new roll takes effect for 2027, that assessment will move toward what was actually paid.
Practical consequence: the tax line in the MLS listing describes the seller’s cost, not yours. For any Ridgewood purchase this year, the useful exercise is to divide the current assessment by the price you expect to pay. If that number lands meaningfully below 0.60, budget for an increase. Section 6 gives the better starting point: 1.944 percent of purchase price, the state’s effective rate on true value, rather than the seller’s bill.7
The effective rate, and the number that is wrong on the internet
Consumer tax sites publish an “effective rate” for Ridgewood near 2.8 percent and a “median home value” near $608,000. Both are assessment figures dressed up as market figures: the value is an assessed value, and the rate is the general rate applied to it. The state’s 2025 effective tax rate for Ridgewood, general rate multiplied by the equalization ratio, is 1.944 percent of true market value, and the state’s average residential bill is $20,596.8 Anyone using the consumer figure to model carrying cost on a purchase price will overstate the tax by roughly 45 percent. Anyone using the seller’s bill will understate it. The state’s number is the one to use.
The appeal calendar, which is easy to get wrong
Bergen County does not run a single appeal deadline. In 2026 there are five different dates depending on which municipality a property sits in. Municipalities undergoing revaluation or reassessment operate on a May 1 deadline rather than the standard April 1.9
Miss it and there is no remedy. The appeal is forfeited for the year, and you wait twelve months.
On the current roll, an appeal succeeds only where the assessment exceeds the upper limit of the common level range, 69.60 percent of market value for 2026.10 In a market where sales run 111 percent of asking, that is a narrow door, and the deed record above shows fewer than one buyer in ten is anywhere near it. Appeals are largely a 2027 question. When the 2027 assessment notices arrive, the window to contest is short and the deadline for a revaluation town is not the one most people have heard of. Verify the current-year date with the Bergen County Board of Taxation before relying on any published figure, including this one.
What to do
- Look up your current assessment in the Village tax records
- Divide it by a realistic estimate of current market value
- If the result is well under 0.60, expect an increase and plan for it
- When the 2027 notice arrives, check the appeal deadline immediately
- Cooperate with the ASI inspection: refusing an interior inspection means the assessor estimates, and estimates are not usually generous
What I tell my buyers: run this calculation before you write the offer, not after you close. The deed record says the typical buyer in the last twenty months is assessed at half of what they paid. On a $1.5 million purchase that is a five-figure annual difference once the roll resets, and it belongs in your carrying-cost math alongside the mortgage and the insurance. Almost nobody puts it there.
† Figures marked with a dagger are best-effort research, so verify them with the issuing office (the Village of Ridgewood, the school district, the county, the state or the utility) before making judgment calls or decisions on them.
3. Market Conditions
Two terms come up throughout this report. Percent of asking is what a home sold for divided by what it was listed for; above 100 means it sold for more than the seller asked. Days on market is the time from listing to accepted offer.
Six years, one direction
| Year | Median sale price | Percent of asking paid | Sold above asking | Median days on market |
|---|---|---|---|---|
| 2021 | $890,000 | 100.8% | 56% | 12 |
| 2022 | $950,000 | 102.3% | 63% | 12 |
| 2023 | $975,000 | 105.7% | 75% | 12 |
| 2024 | $1,178,000 | 108.0% | 75% | 11 |
| 2025 | $1,265,000 | 108.9% | 80% | 12 |
| 2026 (through August) | $1,460,088 | 111.2% | 76% | 11 |
The median Ridgewood home sold for 64 percent more in 2026 than in 2021.
Two things in this table are unusual, even for Bergen County.
Buyers have paid more over asking every single year. From 100.8 percent to 111.2 percent, with no year in which Ridgewood buyers got a better deal relative to asking than the year before. That includes the period when mortgage rates more than doubled. The market did not pause.
Homes have sold in eleven or twelve days every year. The market has been at full speed since 2021. It could not go faster, so the pressure showed up in price instead.
Why: fewer sellers, not more buyers
About 355 homes changed hands in 2021. In 2024 and 2025 it was closer to 227 a year, a drop of roughly a third, while prices rose 64 percent.
If a wave of new buyers were chasing Ridgewood, sales would rise along with prices. They fell. What happened is that fewer owners chose to sell, the number of homes available shrank, and the buyers who were already here competed harder for what remained.
That distinction matters if you are trying to guess what comes next. A market driven by a surge of demand cools when the demand cools. A market driven by a shortage of listings stays this way until more owners decide to sell. Section 5 covers what might change that.
Ridgewood is three markets, not one
The town-wide numbers hide more than they show. Split the last twenty months of sales by price and the Village separates into three distinct markets.
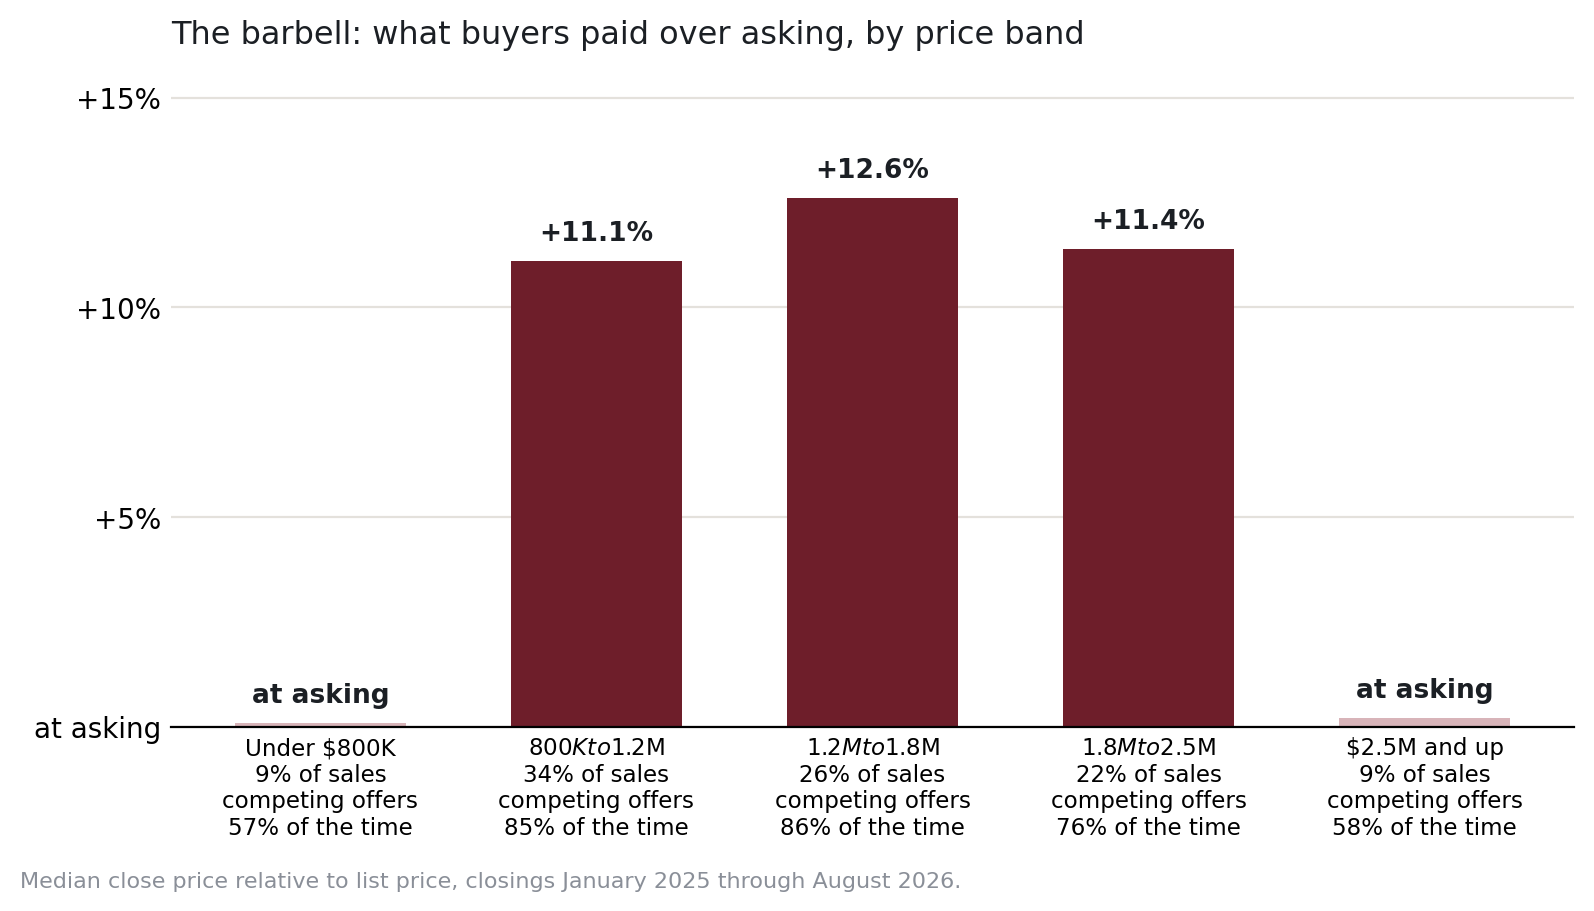
| Price band | Share of sales | Percent of asking paid | Sold above asking | Median days on market |
|---|---|---|---|---|
| Under $800,000 | 9% | 100.1% | 57% | 16 |
| $800,000 to $1.2 million | 34% | 111.1% | 85% | 12 |
| $1.2 million to $1.8 million | 26% | 112.6% | 86% | 11.5 |
| $1.8 million to $2.5 million | 22% | 111.4% | 76% | 9 |
| $2.5 million and above | 9% | 100.2% | 58% | 14 |
Closings January 2025 through August 2026.
The shape is a barbell. At both ends of the market, homes sell at about asking and a buyer faces competition roughly half the time. In the middle, from $800,000 to $2.5 million, which is where 82 percent of Ridgewood homes trade, buyers pay 11 to 13 percent over asking and face competing offers on more than three out of four homes.
A buyer at $2.8 million and a buyer at $1.3 million are in different markets that share a zip code. Advice built on the town-wide average is wrong for both of them.
By bedroom count
| Bedrooms | Median sale price | Percent of asking paid | Median days on market |
|---|---|---|---|
| 3 | $975,000 | 112.5% | 11 |
| 4 | $1,300,000 | 112.5% | 12 |
| 5 or more | $2,100,000 | 104.8% | 13 |
Closings January 2025 through August 2026. Two-bedroom homes are too few to report reliably.
Three- and four-bedroom homes behave identically and are the most competitive product in the Village. Five-bedroom homes, which sit at the top of the price range, sell much closer to asking. That is the same softness at the top of the market that the barbell shows, confirmed from a second direction.
The calendar is worth real money
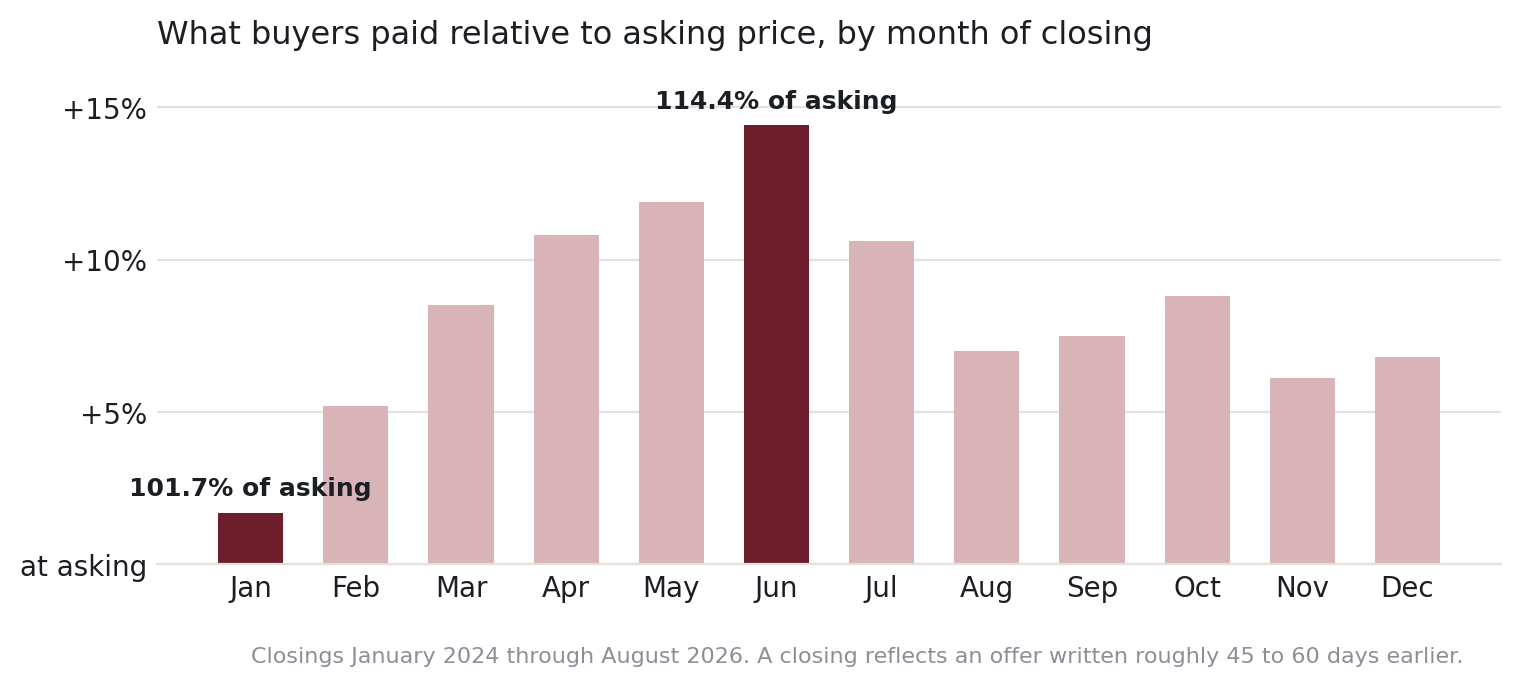
| Closing month | Percent of asking paid | Median days on market |
|---|---|---|
| January | 101.7% | 16.5 |
| February | 105.2% | 24.5 |
| March | 108.5% | 11.5 |
| April | 110.8% | 10 |
| May | 111.9% | 9 |
| June | 114.4% | 9.5 |
| July | 110.6% | 10 |
| August | 107.0% | 12 |
| September | 107.5% | 13.5 |
| October | 108.8% | 10 |
| November | 106.1% | 14 |
| December | 106.8% | 12 |
Closings January 2024 through August 2026.
The gap between the June peak and the January trough is 12.7 points of asking price. On a $1.2 million home, that is roughly $150,000 of difference in what buyers paid relative to asking.
One thing to keep in mind: these are closing months, and a closing reflects an offer written 45 to 60 days earlier. The June peak is April and May contract activity. Read it as: offers written in spring face the most competition; offers written in late autumn face the least.
The trade-off is choice. January and February have the fewest new listings. A winter buyer competes less and chooses from less.
For sellers: not every listing sells
The strength of this market hides one fact that matters to sellers. Since the start of 2021, about one Ridgewood listing in five did not sell: it expired or was withdrawn. Those listings carried the highest asking prices of any group, well above what actually closed. The market pays 11 percent over asking for a house priced to it; it does not rescue a house priced above it. Section 5’s figures on the top of the market are the same lesson from the other side.
What I tell my buyers: if your timing is flexible, the calendar is the cheapest negotiating tool you have. If it is not, know which month you are in and price your offer for it.
4. What It Takes to Win
The question every Ridgewood buyer asks is some version of “how much over asking do I need to go?” Here is the answer, with the range behind it rather than a single number.
The competitive zone
Between $800,000 and $1.8 million, where six out of ten Ridgewood homes sell, this is how the last twenty months of closings came out:
| Close price as a percent of asking | |
|---|---|
| A quarter of homes sold below | 103.1% |
| Half sold below, half above | 111.2% |
| Three-quarters sold below | 121.0% |
| Nine in ten sold below | 127.8% |
- Seven in ten of these homes sold at or above 105 percent of asking
- More than half sold at or above 110 percent
- More than a quarter sold at or above 120 percent
An offer at asking price in this range is not a competitive offer. Roughly 85 percent of the homes sold for more than that. It loses.
The one-line version
At $1.4 million in Ridgewood, expect to pay roughly 12 percent over asking, expect other offers about 86 percent of the time, and expect to decide within eleven days.
Adjust from there:
| If you are buying at | Plan for | Chance of competing offers | Decision window |
|---|---|---|---|
| Under $800,000 | Near asking | About 1 in 2 | About 16 days |
| $800,000 to $1.2 million | 11% over | 85% | About 12 days |
| $1.2 million to $1.8 million | 13% over | 86% | About 12 days |
| $1.8 million to $2.5 million | 11% over | 76% | About 9 days |
| $2.5 million and above | Near asking; negotiate | About 1 in 2 | About 14 days |
Price is not the whole offer
These numbers describe price. They do not describe the other terms that decide contests between offers that are close on price: inspection scope, mortgage and appraisal contingencies, attorney review posture, deposit size, closing date, and whether the seller needs to stay a few weeks after closing.
Those terms routinely decide contests between offers within a few thousand dollars of each other, and a buyer who wins on terms pays less. Do not read the percentages above as a bidding instruction. They describe the field. The strategy is the conversation we have about your specific house.
The eleven-day reality
Eleven or twelve days on market is not eleven days of leisurely consideration. Work backward from a typical Ridgewood listing: it goes live midweek, holds a weekend open house, and reviews offers early the following week. A buyer who first sees a home on Sunday is often making a decision by Tuesday.
That compresses everything. Pre-approval has to be in hand and current, not pending. An attorney has to be identified before you start looking, not after you write. If you need to see a house twice before deciding, the second showing has to happen inside the first weekend.
What I tell my buyers: the number that loses deals in Ridgewood is not the offer price. It is the two days spent getting a pre-approval refreshed while someone else’s offer gets accepted. Have the paperwork done before you fall in love with a house.
The exception worth knowing
Above $2.5 million and, separately, below $800,000, it is a different market. At those price points roughly four in ten homes sold at or below asking, and homes take longer to go under contract. Buyers in those bands have negotiating room that buyers in the middle simply do not have.
If you are shopping at $2.6 million, the strategy that wins at $1.3 million is not just unnecessary. It is expensive.
5. Inventory, Pipeline and Liquidity
Twelve houses
On August 29, 2026, there were 12 homes for sale in the entire Village of Ridgewood.
Ridgewood sells about 19 homes a month. Twelve for sale against that pace is less than three weeks of supply. A balanced market carries five to six months.
This one figure explains everything in Section 3. Prices are not rising because buyers have suddenly become more enthusiastic about Ridgewood. They are rising because there is very little to buy, and the people who want to live here compete for a dozen houses.
Inventory changes weekly. This count is a snapshot as of the date above.
Where the twelve houses are
| Price band | For sale | Median days on market | Share of what is for sale | Share of what sells |
|---|---|---|---|---|
| Under $800,000 | 3 | 8 | 25% | 9% |
| $800,000 to $1.2 million | 3 | 9 | 25% | 34% |
| $1.2 million to $1.8 million | 1 | 37 | 8% | 26% |
| $1.8 million to $2.5 million | 1 | 35 | 8% | 22% |
| $2.5 million and above | 4 | 92 | 33% | 9% |
There is one home for sale between $1.2 million and $1.8 million, in a price band that accounts for a quarter of all Ridgewood sales.
Meanwhile a third of everything for sale is above $2.5 million, a band that accounts for 9 percent of sales, and those homes have been sitting a median of 92 days. What is available is concentrated exactly where demand is thinnest.
What is under contract, and what it tells you
Twenty-one homes were under contract on the same date. Comparing them with what is still for sale shows how fast each part of the market is clearing.
| Price band | Under contract | For sale | Under contract for every home for sale |
|---|---|---|---|
| Under $800,000 | 2 | 3 | less than 1 |
| $800,000 to $1.2 million | 12 | 3 | 4 |
| $1.2 million to $1.8 million | 4 | 1 | 4 |
| $1.8 million to $2.5 million | 0 | 1 | 0 |
| $2.5 million and above | 3 | 4 | less than 1 |
Between $800,000 and $1.8 million, four homes are under contract for every one still available. That is a market clearing faster than sellers can replace it. At the top, more homes are sitting than moving.
The point for a buyer: the middle of the market is not just competitive on price, it is competitive on availability. When a home in your band comes up, it may be the only one for weeks.
One line to watch. The $1.8 million to $2.5 million band has been the fastest-moving segment in the Village, but on this date it had nothing under contract. With numbers this small, that may mean nothing. It may also be the first sign that the slowness at the very top is spreading downward. The next quarterly update will say which.
A note on the next few months of headlines
The homes under contract right now are mostly in the $800,000 to $1.2 million range, because that is where most of the activity was this summer. When they close in September and October, the Village’s reported “median sale price” will drop, probably well below the $1.46 million figure for the year so far.
That will not mean prices fell. It will mean that the homes closing in those months happen to be less expensive homes. If you see a headline this autumn saying Ridgewood prices are down, check what sold, not just the number. This report will make the same point again when it happens.
Liquidity, or how fast a house turns back into cash
Appreciation is the number buyers ask about. Liquidity is the number that matters if plans change and you need to sell.
In Ridgewood, the two are not the same. Three independent measures point the same way:
- What is for sale: homes above $2.5 million have sat a median 92 days; homes below $1.2 million, 8 to 9 days.
- What is under contract: homes above $2.5 million took a median 33 days to find a buyer; homes between $1.2 million and $1.8 million took under 8.
- What has sold: five-plus-bedroom homes sold at about 105 percent of asking; three- and four-bedroom homes at 112.5 percent.
The top of the Ridgewood market is materially slower than the middle. A $2.8 million house is a fine house. It is a slower asset, and a buyer who might need to sell within three to five years should price that in.
The mirror image is good news for a certain kind of buyer. That slowness is exactly why the top of the market negotiates. Buyers above $2.5 million have leverage that buyers at $1.3 million cannot get at any price.
Two current examples: one listing at $10 million has been on the market more than a year and recently cut its price by 20 percent. Another, at $5.2 million, is past 100 days. Neither is competing with anything. They share a municipal boundary with the rest of Ridgewood and very little else.
What happened the last time the market turned
Everything above describes a rising market, because that is what the last six years contain. It would be dishonest to present that as evidence of what happens when the market falls. So here is what happened the last time it did.
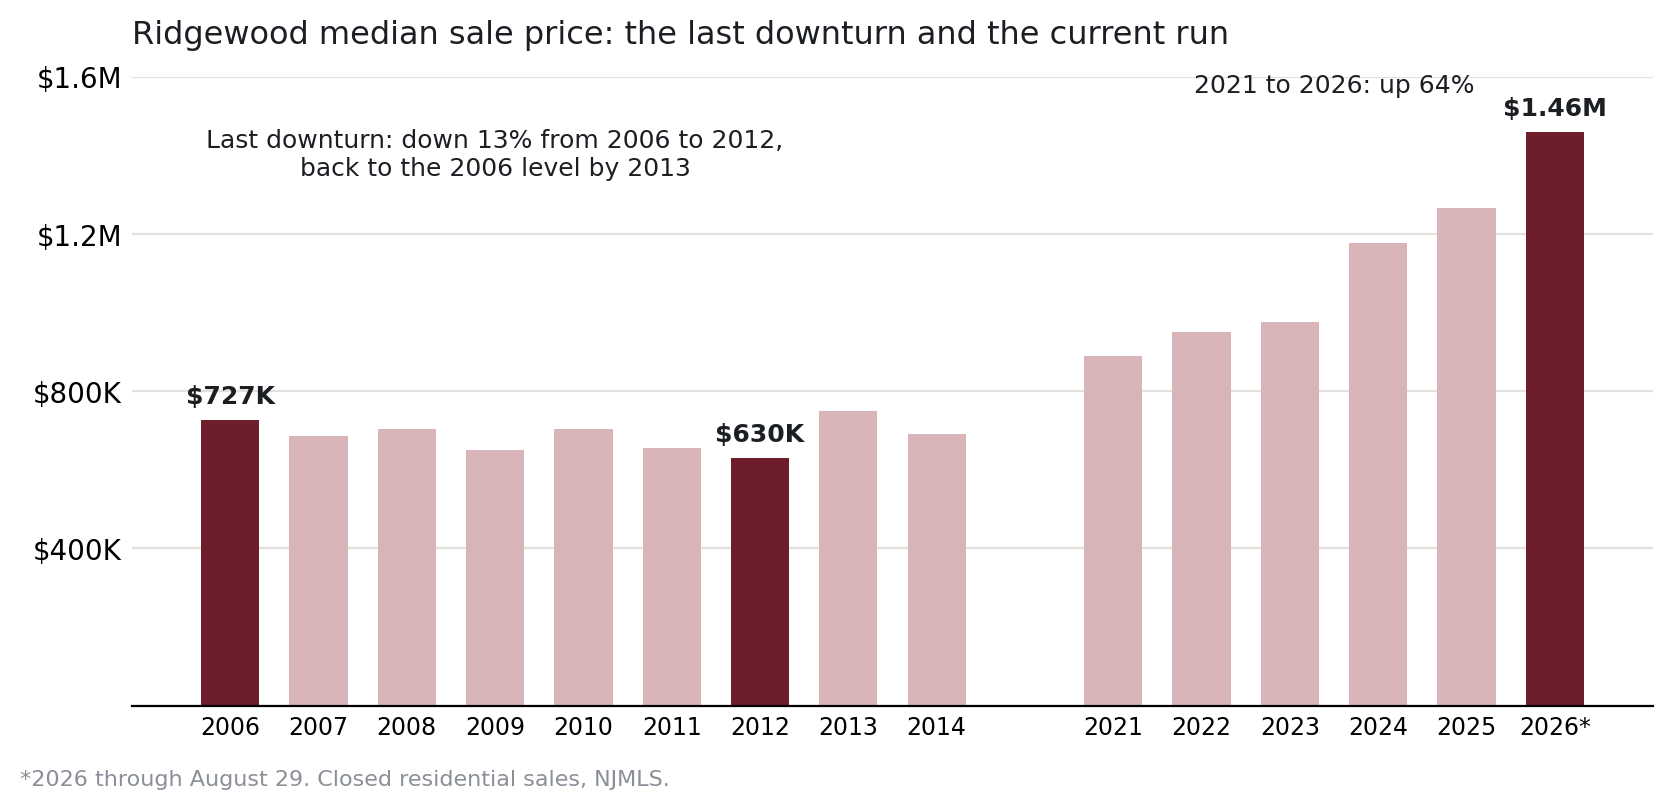
| Year | Homes sold | Median sale price | Percent of asking paid | Sold above asking | Median days on market |
|---|---|---|---|---|---|
| 2006 | 286 | $727,000 | 97.7% | 17% | 48 |
| 2007 | 315 | $685,000 | 97.9% | 18% | 39 |
| 2008 | 228 | $704,500 | 96.8% | 11% | 50 |
| 2009 | 209 | $650,000 | 96.0% | 10% | 54 |
| 2010 | 264 | $705,000 | 97.3% | 16% | 36 |
| 2011 | 246 | $654,750 | 97.3% | 13% | 41 |
| 2012 | 310 | $630,000 | 97.0% | 14% | 41 |
| 2013 | 316 | $749,500 | 98.5% | 28% | 32 |
| 2014 | 298 | $690,000 | 99.2% | 31% | 28 |
Closed residential sales in the Village of Ridgewood, 2006 through 2014.
Three things stand out.
Ridgewood fell, but it did not collapse. The median sale price went from $727,000 in 2006 to $630,000 in 2012, a decline of about 13 percent over six years, and was back above the 2006 level by 2013. Year to year the median bounced around with the mix of what sold; the average sale price tells the same story more smoothly, down about 12 percent from 2006 to 2012 and within 2 percent of the 2006 level by 2013. Sales volume fell by more than a quarter, to 209 homes in 2009, before recovering.
It was a slow market, not a cheap one. Through the whole period buyers paid 96 to 98 percent of asking, one in ten to one in six homes sold above asking, and homes took five to eight weeks to go under contract. Compare that with 2026: 111 percent of asking, three in four above asking, eleven days. The 2013 figures, when the market turned up, were 98.5 percent of asking, 28 percent above asking, and 32 days. Today’s market is not a slightly stronger version of a normal one. It is a different regime.
Recovery came from the same place the current run did. Volume returned first (310 sales in 2012, 316 in 2013), then the share sold above asking doubled, then price. That is the order to watch for in reverse: if the share of homes selling above asking starts falling from 76 percent while days on market lengthen, price is the last thing to move, not the first.
What this means for a buyer today: the last time Ridgewood turned, an owner who bought at the 2006 peak and needed to sell in 2009 to 2012 took a loss of roughly 10 to 13 percent before costs, and an owner who could hold seven years did not. The buyers most exposed to any repeat are the ones who bought most recently at the largest premium to assessment, and Section 2 shows that group is large. A market that has moved 64 percent in five years on three weeks of supply has been tested once in the last twenty years, and that is how it did.
What could change this
Honest forecasting means naming what would break the pattern.
- More homes for sale. The whole dynamic rests on a dozen listings. A meaningful increase, from new construction, from normal turnover resuming, or from the 2027 revaluation prompting long-time owners to sell, changes the arithmetic quickly.
- The revaluation itself. Section 2 describes a tax reset landing in 2027. Owners facing large increases may decide to list. That is the most plausible near-term source of new supply.
- The top-end slowness spreading. The softness above $2.5 million has been stable, not spreading. If it moves down into the $1.8 million to $2.5 million band, the empty line in the table above will turn out to have been the first sign.
6. Taxes and Carrying Cost
Section 2 explained why the tax figure on a Ridgewood listing sheet is not the tax a buyer will pay after 2027. This section covers the tax that owners pay now: what the 2025 bill is made of, who levies each piece, how it compares to neighboring towns, and what is already in motion for 2026 and 2027. All figures are from the New Jersey Division of Taxation, the Bergen County Board of Taxation, or the NJ Department of Education unless marked otherwise.
The 2025 bill, piece by piece
The 2025 general tax rate for Ridgewood is $2.890 per $100 of assessed value.11 Applied to the Village’s average residential assessment of $712,672, that produces an average residential tax bill of $20,596.12
The total 2025 levy was $177,184,298, raised on a net taxable valuation of $6,133,035,300.13 It splits six ways:
| Component (2025) | Levy | Share | Rate per $100 | On the average home ($712,672) |
|---|---|---|---|---|
| Ridgewood Public Schools | $110,431,377 | 62.3% | 1.801 | $12,833 |
| Village municipal purposes | $42,256,311 | 23.8% | 0.689 | $4,910 |
| Bergen County | $20,348,942 | 11.5% | 0.332 | $2,365 |
| Ridgewood Public Library | $2,933,321 | 1.7% | 0.048 | $341 |
| County open space | $911,345 | 0.5% | 0.015 | $106 |
| Municipal open space | $303,000 | 0.2% | 0.005 | $35 |
| Total | $177,184,298 | 100% | 2.890 | $20,596 |
Component rates are computed as levy divided by net taxable valuation; they sum to the certified 2.890. Dollar amounts on the average home are rounded.14
Three points follow from the table.
The Village Council controls about a quarter of the bill. The school district sets 62% of it through its own budget process, and the county sets 12%. A resident arguing about the municipal budget at Village Hall is arguing about $4,910 of a $20,596 bill.
The levy grew faster than the average bill. Ridgewood’s 2024 levy was approximately $170.1 million (2.869 rate on $5,930,301,800 net valuation).15 The 2025 levy of $177.2 million is a 4.1% increase. The average residential bill rose 1.1% over the same period ($20,375 to $20,596).16 The gap is explained by the ratable base, below.
The 2% levy cap is not a 2% ceiling on your bill. New Jersey’s cap allows exclusions for health benefits, pensions, debt service and capital, and permits banked cap from prior years. The school district’s 2026-27 general fund levy rose 4.0% ($107,392,191 to $111,687,878) under those adjustments.17 The Village’s own 2026 Budget Presentation states a 3.98% increase in the municipal tax levy, driven in part by a $1.3 million increase in employee healthcare and prescription costs.18 The adopted 2025 municipal levy was $42,256,311 and the 2024 levy $39,658,266, per the Village’s 2025 and 2024 budget presentations.19
The ratable base, and the hospital
Ridgewood’s tax base is residential. Multiplying the Class 2 line-item count by the average residential assessment gives approximately $5.30 billion of residential assessed value, or 86.5% of the $6.13 billion base.2021 The remaining 13.5% is vacant land, commercial, industrial and apartment property combined.†
The practical meaning: there is almost no commercial base to absorb levy growth. When the levy rises, homeowners pay it.
The one exception was temporary. When The Valley Hospital moved its inpatient campus to Paramus in April 2024, the North Van Dien Avenue property lost its exemption and came onto the tax roll. Net taxable valuation grew from $5.93 billion (October 1, 2024) to $6.13 billion (October 1, 2025), a $203 million increase in a year with no revaluation.2223 That single ratable is why a 4.1% levy increase produced a 1.1% bill increase in 2025; the Village’s own 2025 budget commentary stated the municipal increase would have been roughly 6.6% without it.24
On May 7, 2026, a judge ruled the Valley property exempt from taxation while its appeal is pending, under N.J.S.A. 54:3-27.25 The assessed value at issue is reported as $184,103,600, which at the 2025 rate is about $5.32 million a year in taxes across all taxing entities, or 3.0% of the levy.26 If the property leaves the roll permanently, that $5.32 million redistributes to every other owner: a 3.1% increase in everyone else’s share, before any budget growth. If the Village has already collected 2024 and 2025 taxes on it and loses, refunds with interest follow.†
What 2026 already looks like
2026 tax bills were mailed in August 2026 with a payment deadline extended to September 18. The Village reported the combined 2026 tax rate as 4.78% above 2025, with the municipal portion up 3.92%.27 Applying 4.78% to the 2025 rate implies a 2026 general rate near $3.03 per $100, and an average bill near $21,600 on an unchanged average assessment.†
The school side is confirmed from primary documents: the 2026-27 total school levy is $114,713,852 (general fund plus $3,025,974 debt service), up 3.9% from $110,431,377.28 Ridgewood voters also doubled the municipal open space tax from 0.5 cents to 1 cent per $100 on November 4, 2025 (5,299 yes to 3,666 no, 59.1%), adding about $36 to the average bill.29
Effective tax rate: what a buyer actually pays
Because Ridgewood assessments sit well below market, the general tax rate overstates what a buyer pays as a share of price. The Division of Taxation publishes an effective tax rate (general rate multiplied by the equalization ratio) for exactly this purpose.
Ridgewood’s 2025 effective tax rate is 1.944% of true market value.30
A buyer closing at the 2026 year-to-date median of $1,460,088 (Section 3) should therefore budget roughly $28,400 a year in property tax at market-equivalent rates, before the 2027 revaluation and before 2026 and 2027 levy growth. That is $2,365 a month. The listing sheet will typically show the seller’s bill, which averages $20,596 and reflects an assessment set in 2013.
Ridgewood against its neighbors
2025, New Jersey Division of Taxation3132
| Municipality | General rate | Effective rate | Avg residential assessment | Avg residential bill | Avg 2025 sale price (n) | 2027 reval? |
|---|---|---|---|---|---|---|
| Ridgewood | 2.890 | 1.944 | $712,672 | $20,596 | $1,345,963 (204) | Yes |
| Glen Rock | 3.407 | 2.436 | $591,156 | $20,141 | $1,030,425 (106) | Yes |
| Ho-Ho-Kus | 2.501 | 1.706 | $793,060 | $19,834 | $1,285,829 (51) | 2026 |
| Wyckoff | 2.026 | 1.708 | $810,726 | $16,425 | $1,121,234 (183) | Yes |
| Midland Park | 3.688 | 2.372 | $404,240 | $14,908 | $760,030 (48) | Yes |
| Paramus | 1.499 | 1.434 | $871,335 | $13,061 | $1,222,160 (99) | 2026 |
| Bergen County | n/a | 1.951* | $587,252 | $14,200 | $869,612 (5,295) | |
| New Jersey | n/a | n/a | $404,656 | $10,340 | $637,862 (61,928) |
*County effective rate computed as total county levy ($4,775,463,065) divided by county true value ($244,777,970,432).33 “2027 reval” from the Bergen County Board of Taxation’s January 7, 2026 schedule.34
| Municipality | General rate | Effective rate | Avg residential assessment | Avg residential bill |
|---|---|---|---|---|
| Ridgewood | 2.869 | 2.024 | $710,168 | $20,375 |
| Glen Rock | 3.288 | 2.539 | $587,060 | $19,303 |
| Ho-Ho-Kus | 2.407 | 1.789 | $786,774 | $18,938 |
| Wyckoff | 1.950 | 1.757 | $810,110 | $15,797 |
| Midland Park | 3.480 | 2.464 | $403,107 | $14,028 |
| Paramus | 1.514 | 1.481 | $798,885 | $12,095 |
| Bergen County | $550,530 | $13,600 | ||
| New Jersey | $382,475 | $9,898 |
The unflattering reading is straightforward. Ridgewood has the highest average residential tax bill of the six towns, 45% above the Bergen County average and 58% above Wyckoff, a town with a comparable average sale price. Measured by effective rate, Ridgewood sits in the middle: below Glen Rock and Midland Park, above Ho-Ho-Kus, Wyckoff and Paramus, and roughly at the county figure. Paramus’s rate is a product of its commercial base (Route 17 and Route 4 retail), which Ridgewood does not have and cannot build.
Ridgewood’s effective rate fell from 2.024% to 1.944% between 2024 and 2025. That is not a tax cut. It is the arithmetic of prices rising faster than the levy: the true-value denominator grew 15% while the levy grew 4%.
The ratio history, and what it says about 2027
The Village’s last full revaluation was 2008, with a reassessment in 2013; before that, a revaluation in 2001 and a reassessment in 1993.37 The Director’s Ratio since then shows the drift Section 2 describes.
| Table of Equalized Valuations (certified Oct 1 of year) | Applies to tax year | Ridgewood average ratio |
|---|---|---|
| 2018 | 2019 | 85.63% |
| 2019 | 2020 | 86.48% |
| 2020 | 2021 | 85.97% |
| 2021 | 2022 | 84.43% |
| 2022 | 2023 | 75.75% |
| 2023 | 2024 | 70.66% |
| 2024 | 2025 | 67.39% |
| 2025 | 2026 | 60.52% |
Two things to notice. The ratio held near 86% for four years, then fell 26 points in five, which is the 2021 to 2026 price run in Section 3 expressed as an assessment statistic. And the figure for tax year 2026 is 60.52%, not the 67.39% cited in Section 2; the Chapter 123 common level range for 2026 appeals is 51.44% to 69.60%.39 Section 2’s rule of thumb should use 60.5% for any 2026 comparison: a home assessed below about 60% of what it would sell for is under-assessed relative to the Village average and should expect its share to rise in 2027.
At a 60.52% ratio, the 2027 revaluation will lift the aggregate assessment by roughly 65% and the general rate will fall proportionally, to somewhere near $1.85 per $100 on the 2025 levy. A lower rate on a higher assessment is the same bill for the average home. It is a different bill for the homes that have drifted.
Glen Rock, Wyckoff and Midland Park are on the same 2027 revaluation schedule; Ho-Ho-Kus and Paramus revalued for 2026.40 Comparing 2027 rates across these towns will be more honest than it has been in a decade.
Tax appeals
The Division of Taxation publishes appeal statistics by county, not by municipality. For Bergen County in 2025: 189 assessments were revised, 88 affirmed, 377 withdrawn, 82 dismissed without prejudice, and 775 resolved by stipulation or dismissal with prejudice.41 Filings equal 0.42% of the county’s 253,428 residential line items. Total reductions were $473 million on $4.91 billion of assessed value appealed (9.6%), with commercial appeals (506 filings) driving most of the dollars. In 2024, Bergen had 1,918 filings (1,215 residential) and 206 revisions.42†
The relevant point for 2026: with a ratio of 60.52%, a Ridgewood owner wins an appeal only by showing the assessment exceeds 69.60% of market value. In a market where sales run 111% of asking, that is a narrow door. Appeals on the current roll are largely a 2027 question.
Relief programs, as they apply here
Three state programs reduce the bill for eligible owners. All three are claimed on a single Form PAS-1; the deadline for the 2025 benefit year is November 2, 2026.43
- ANCHOR (homeowners): $1,500 for NJ gross income of $150,000 or less; $1,000 for $150,001 to $250,000.44
- Senior Freeze: age 65 or older (or on Social Security disability) by December 31, 2025; income $168,268 or less in 2024 and $172,475 or less in 2025; owned and occupied the home since December 31, 2022 or earlier. Reimburses increases above a base-year bill.45
- Stay NJ: age 65 or older, income of $200,000 or less, owned and occupied for the full year. Maximum benefit $6,500 (income to $100,000), $5,000 ($100,000 to $150,000), $4,000 ($150,000 to $200,000). 2025 benefits are paid in February and May 2027.46
Against a $20,596 average bill, ANCHOR is worth 5% to 7%. Stay NJ can be worth up to 32% for a qualifying senior. Buyers at Ridgewood’s 2026 price points, with the incomes those prices imply, will mostly qualify for none of them. The programs matter for the seller side: a long-tenured owner drawing Senior Freeze has a bill frozen at a base year, and the 2027 revaluation does not unfreeze it. That reduces one of the motivations to sell that Section 5 counts on for new supply.
What I tell my buyers: use 1.95% of your purchase price, not the number on the listing, as the tax line in your carrying-cost model, then add 4% to 5% a year for the next two years because that is what the school and Village levies are actually doing. On a $1.46 million purchase that is about $28,400 now and roughly $31,000 by 2028, before the revaluation redistributes it.
† Figures marked with a dagger are best-effort research, so verify them with the issuing office (the Village of Ridgewood, the school district, the county, the state or the utility) before making judgment calls or decisions on them.
7. Schools
This section reports what the New Jersey Department of Education and the Ridgewood Board of Education publish about the Ridgewood Public Schools. It does not reproduce any consumer rating. Every figure carries a bracketed citation to the Source list at the end of the section. Where a figure has moved the wrong way year over year, it is stated as such.
District profile
Ridgewood Public Schools (NJ DOE district code 03-4390) operates ten schools: Glen School (pre-kindergarten and district special programs), six K-5 elementary schools (Hawes, Orchard, Ridge, Somerville, Travell, Willard), two grade 6-8 middle schools (Benjamin Franklin and George Washington), and Ridgewood High School (grades 9-12). [1][2]
As of October 15, 2025, the district reported 5,361 students on roll in its budget filing (4,794 general education, 567 special education), plus 117 students received from other districts on a tuition basis. [3] The district’s audited average daily enrollment for 2024-25 was 5,412. [4]
Student population, 2023-24: 2.3% economically disadvantaged, 12.2% students with disabilities, 2.2% multilingual learners. [1]
Enrollment: seven consecutive years of decline
Average daily enrollment, from the district’s audited financial statements: [4]
| School year | Average daily enrollment | Change |
|---|---|---|
| 2015-16 | 5,655 | +0.09% |
| 2016-17 | 5,659 | +0.07% |
| 2017-18 | 5,664 | +0.09% |
| 2018-19 | 5,652 | -0.21% |
| 2019-20 | 5,694 | +0.74% |
| 2020-21 | 5,545 | -2.62% |
| 2021-22 | 5,577 | +0.58% |
| 2022-23 | 5,504 | -1.30% |
| 2023-24 | 5,492 | -0.22% |
| 2024-25 | 5,412 | -1.46% |
From the 2019-20 peak, enrollment is down 282 students, or 5.0%. The budget filing for 2026-27 projects 5,383 on roll for October 2026. [3] The audit reports an October 15, 2025 count of 5,433, 56 fewer than October 2024. [4] The two October 2025 figures (5,361 on roll in the budget filing versus 5,433 in the audit) use different counting bases; both are reproduced here as published.
Enrollment by school: [5][6][7][8][9][10][11][12][13][14]
| School | Grades | 2021-22 | 2022-23 | 2023-24 | 2024-25 | 3-yr change |
|---|---|---|---|---|---|---|
| Hawes | K-5 | 369 | 364 | 378 | 357 | -3.3% |
| Orchard | K-5 | 323 | 346 | 359 | 348 | +7.7% |
| Ridge | K-5 | 457 | 433 | 439 | 448 | -2.0% |
| Somerville | K-5 | 372 | 376 | 385 | 394 | +5.9% |
| Travell | K-5 | 354 | 352 | 328 | 295 | -16.7% |
| Willard | K-5 | 489 | 470 | 470 | 440 | -10.0% |
| Benjamin Franklin MS | 6-8 | 699 | 680 | 639 | 627 | -10.3% |
| George Washington MS | 6-8 | 636 | 638 | 650 | 644 | +1.3% |
| Ridgewood HS | 9-12 | 1,775 | 1,742 | 1,735 | 1,740 | -2.0% |
| Glen School | PK | n/a | n/a | 119 | 126 | n/a |
2021-22 through 2023-24 from NJ DOE School Performance Reports; 2024-25 from NJ DOE fall enrollment as reported through NCES. The 2024-25 column sums to 5,419. [14]
Travell has lost one student in six since 2021-22. Its 2023-24 kindergarten class was 36, against 50 and 56 in the two prior years. [10] Benjamin Franklin has lost 72 students over the same period while George Washington has been flat, which is relevant to the boundary discussion below.
Per-pupil spending: lowest of the six neighboring districts, and below the state average
NJ DOE’s Taxpayers’ Guide to Education Spending defines the Total Budgetary Cost Per Pupil as the comparable operating cost, excluding transportation, debt service, and out-of-district tuition. [15] The figures below are the audited actuals and adopted budgets as filed in each district’s 2026-27 User Friendly Budget. [3][16][17][18][19][20]
| District | 2023-24 actual | 2024-25 actual | 2025-26 revised | 2026-27 budget |
|---|---|---|---|---|
| Ridgewood | $18,650 | $19,713 | $21,513 | $21,796 |
| Glen Rock | $19,047 | $20,084 | $22,782 | $23,959 |
| Ho-Ho-Kus (K-8) | $20,106 | $20,354 | $20,813 | $24,351 |
| Wyckoff (K-8) | $19,888 | $20,428 | $22,302 | $23,174 |
| Midland Park | $25,079 | $25,732 | $27,238 | $27,050 |
| Paramus | $22,902 | $23,990 | $26,227 | $26,695 |
| New Jersey average | $19,286 | $21,199 (budgeted) | n/a | n/a |
State average from the NJ DOE release accompanying the 2025 Taxpayers’ Guide; the 2024-25 state figure is a budgeted amount, not an audited actual. Comparators are as published in each district’s filing. [21]
Ridgewood spends the least per pupil of the six districts in every year shown, and spent 3.3% less than the state average in 2023-24. The 2023-24 Taxpayers’ Guide figures for Ridgewood, from the same source, are a ratio of 12.2 students per teacher, a median teacher salary of $97,767, 67.8 students per support staff member, and 171.6 students per administrator. [22] The 2024-25 budgeted figures were 12.1 students per teacher and a median teacher salary of $96,627. [23]
Employee benefits as a percentage of salaries rose in every year filed: 21.32% (2023-24), 23.24% (2024-25), 26.48% (2025-26 revised), 29.52% (2026-27 budget). [3] That is the line to watch; it grows regardless of enrollment.
Class size and staffing
NJ DOE does not publish class size. It publishes staffing ratios. [1][2][5]-[13]
| School | Students per teacher | Students per administrator | Teachers with 4+ years in district | Avg. years in district |
|---|---|---|---|---|
| Hawes | 11:1 | 378:1 | 72.7% | 11.1 |
| Orchard | 11:1 | 359:1 | 68.8% (22 of 32) | 10.8 |
| Ridge | 12:1 | 439:1 | 83.8% (31 of 37) | 13.0 |
| Somerville | 12:1 | 385:1 | 75.0% | 11.7 |
| Travell | 12:1 | 328:1 | 89.3% | n/a (16.1 in public schools) |
| Willard | 13:1 | 470:1 | 91.9% (34 of 37) | 15.6 |
| Benjamin Franklin | approx. 11:1 | approx. 213:1 | 75.0% | 10.9 |
| George Washington | approx. 11:1 | approx. 217:1 | 81.7% | 13.3 |
| District | 12:1 | 172:1 | n/a | 14.7 (avg. experience) |
2023-24 School Performance Reports. Middle school ratios are computed from the published teacher and administrator counts (60 teachers and 3 administrators at each school). Each elementary school reports one administrator. [5]-[12]
Teacher one-year retention, district-wide: 91.8% of teachers assigned in 2022-23 remained in 2023-24. [7][8][9][10][11] Provisional credentials: 12.5% of Somerville teachers, 8.3% at George Washington, 3.6% at Travell, 0% elsewhere. [8][10][12]
Class size by school and grade: not available at the time of writing.† ### NJSLA proficiency, 2023-24
Percent of students meeting or exceeding expectations. District-wide: ELA 82.8% (state 52.2%), mathematics 69.4% (state 40.2%). Median student growth percentile 54 in both subjects (state 50). [1]
| School | ELA gr. 3 | ELA gr. 4 | ELA gr. 5 | Math gr. 3 | Math gr. 4 | Math gr. 5 | Science gr. 5 |
|---|---|---|---|---|---|---|---|
| Hawes | 79% | 75% | 86% | 77% | 69% | 70% | 59% |
| Orchard | 84% | 84% | 92% | 92% | 86% | 86% | 65% |
| Ridge | 71% | 91% | 87% | 86% | 78% | 77% | 48% |
| Somerville | 80% | 86% | 98% | 87% | 75% | 86% | 62% |
| Travell | 74% | 81% | 88% | 86% | 78% | 84% | 67% |
| Willard | n/a | n/a | n/a | 87% | 75% | 81% | 58% |
| State | 27% |
Willard’s report shows schoolwide ELA of 82.3% and math of 80.6%; grade-level ELA figures were not extracted. [5]-[10]
| School | ELA gr. 6 | ELA gr. 7 | ELA gr. 8 | Math gr. 6 | Math gr. 7 | Math gr. 8 | Science gr. 8 |
|---|---|---|---|---|---|---|---|
| Benjamin Franklin | 80% | 86% | 75% | 71% | 64% | suppressed | 34% |
| George Washington | 83% | 85% | 84% | 78% | 69% | suppressed | 47% |
| State | 19% |
Grade 8 mathematics is suppressed at both middle schools because most eighth graders sit the Algebra I test instead. District Algebra I proficiency was 65%; Geometry was 38%; grade 11 science was 51% (state 28%). [1] At Ridgewood High School, grade 9 ELA was 84% and Algebra I was 59%. [13]
The spread between the two middle schools is 13 points in grade 8 science and 9 points in grade 8 ELA. The spread among elementaries in grade 3 ELA is 13 points (Ridge 71% to Orchard 84%). These are single-year figures from cohorts of 55 to 95 students per grade; a one-year gap of this size is within normal cohort variation and should not be read as a ranking. [5]-[12]
Chronic absenteeism
Percent of students absent 10% or more of enrolled days: [5]-[12]
| School | 2021-22 | 2022-23 | 2023-24 |
|---|---|---|---|
| Hawes | 3.4% | 9.2% | 5.4% |
| Orchard | 4.8% | 7.0% | 5.4% |
| Ridge | 12.2% | 8.9% | 5.6% |
| Somerville | 5.8% | 8.2% | 3.5% |
| Travell | 6.1% | 3.9% | 3.3% |
| Willard | 3.1% | 4.9% | 4.1% |
| Benjamin Franklin | 7.5% | 8.8% | 3.6% |
| George Washington | 6.5% | 8.8% | 4.1% |
| State | 18.1% | 16.6% | 14.9% |
Six of eight schools worsened in 2022-23 before improving in 2023-24. Ridgewood High School and district-wide figures: not available at the time of writing.† ### Graduation and postsecondary
Ridgewood High School, adjusted cohort graduation rates (state figures in parentheses): [13]
| Cohort | 4-year | 5-year |
|---|---|---|
| 2021 | n/a | 97.5% (92.5%) |
| 2022 | 97.1% (90.9%) | 97.3% (92.7%) |
| 2023 | 96.5% (91.1%) | 96.7% (92.6%) |
| 2024 | 97.6% (91.3%) | n/a |
The five-year rate declined in each of the three cohorts shown. Dropout rate: 0.7% (2021-22), 0.3% (2022-23), 0.1% (2023-24). [13]
Postsecondary enrollment 16 months after graduation: not available at the time of writing.† ### Advanced coursework and testing
Of grade 11-12 students, 56.1% were enrolled in at least one AP or IB course in 2023-24 (state 35.9%), down from 57.6% in 2022-23. [1][13][24] Students sat 1,147 AP exams; 1,072 (93.5%) scored 3 or higher. [13] The largest AP enrollments were Computer Science Principles (127), Psychology (99), Physics 1 (82), Statistics (65) and Calculus AB (64). [13] Seventy-five students earned the Seal of Biliteracy. [13]
SAT: 61.3% of seniors participated; averages of 632 reading/writing and 633 math (state 530 and 519). PSAT participation in grades 10-11 was 47.4%, against a state figure of 80.7%. [1][13] The report prints a dual enrollment participation rate of 75.9% (state 26.9%); this is reproduced as printed.†
Attendance boundaries
The district assigns elementary and middle school by home address. School locations, from the state’s reports: [5]-[13]
| School | Address |
|---|---|
| Hawes | 531 Stevens Avenue |
| Orchard | 230 Demarest Street |
| Ridge | 325 West Ridgewood Avenue |
| Somerville | 45 South Pleasant Avenue |
| Travell | 340 Bogert Avenue |
| Willard | 601 Morningside Road |
| Benjamin Franklin MS | 335 North Van Dien Avenue |
| George Washington MS | 155 Washington Place |
| Ridgewood HS | 627 East Ridgewood Avenue |
The street-by-street assignment list and the elementary-to-middle-school feeder pattern: not available at the time of writing.† Whether any boundary has been redrawn since 2020: not available at the time of writing.† The enrollment table above is the reason this matters. Benjamin Franklin has fallen from 699 to 627 while George Washington has held at roughly 640; Travell has fallen from 354 to 295 while Somerville has grown. Uneven decline across buildings of similar capacity is the condition under which districts revisit lines. No such decision is documented in the sources reviewed; a buyer choosing a house for a specific elementary school should confirm the current assignment with the Registrar before contract, and should treat it as an assignment, not a guarantee.
Budget
| 2024-25 actual | 2025-26 | 2026-27 adopted | |
|---|---|---|---|
| General fund | $127.78M | $130.99M original / $132.62M revised | $135.55M |
| Special revenue | $3.15M | $2.66M / $2.68M | $2.46M |
| Debt service | $3.15M | $3.18M | $3.16M |
| Total | $134.07M | $136.83M / $138.47M | $141.18M |
| General fund tax levy | $105,286,462 | $107,392,191 | $111,687,878 |
| Levy change | +2.0% | +4.0% | |
| Debt service levy | $2.55M | $3.04M | $3.03M |
| Tuition revenue (other districts) | $2.33M | $2.93M revised | $3.68M |
| Per pupil (budgetary) | $19,713 | $21,513 revised | $21,796 |
School tax rate on the current (pre-revaluation) assessment base: general fund 1.8109 per $100 in 2025-26, 1.8211 in 2026-27; total school rate including debt service 1.8622 and 1.8704. Net taxable valuation used for the levy: $5.93 billion (2025-26), $6.13 billion estimated (2026-27). Equalized valuation, 2025-26: $8.80 billion. [3][25] The gap between those last two numbers is the same two-thirds ratio described in Section 2, and the school levy is the largest single component of the property tax bill that the 2027 revaluation will redistribute.
Reserves are being drawn down. Capital reserve: $9.94 million at June 30, 2025, budgeted to $6.42 million by June 30, 2027. Maintenance reserve: $3.15 million to roughly zero. Legal reserve: $5.4 million to zero. Emergency reserve: $750,000 to $3,000, after a $500,000 withdrawal in 2025-26 applied to health benefits. Unrestricted fund balance: $2.63 million, about 1.9% of the general fund. [3][26] A district that has spent its reserves finances the next roof through the levy or through a referendum.
Long-term debt: serial bonds payable of $30,205,174 at June 30, 2025. [4]
Referendum history and facilities
Bond referendum dates, amounts and results: not available at the time of writing.† Capital work funded from reserves in 2025-26: elevator systems at Ridgewood High School ($175,000) and George Washington ($185,000); boiler replacement at Willard ($600,000); gym air conditioning at Hawes ($500,000); roof replacement at Orchard ($313,629). [26] In FY2025 the district used capital reserve and state ROD grant funds for HVAC upgrades at Glen School and Ridge and a dust-collection system at the high school woodshop. [4] The 2026-27 budget withdraws a further $1.74 million from capital reserve and $1.40 million from maintenance reserve; projects are not itemized in the state filing. [3]
Long-range facilities plan status and any planned referendum: not available at the time of writing.† ### Ho-Ho-Kus
Ho-Ho-Kus operates a single K-8 school and sends its high school students out of district. Its 2026-27 budget filing shows 197 general-education students sent to other districts as of October 2024, 174 as of October 2025, and 161 estimated for October 2026, with total tuition payments to other public districts of $6.06 million (2024-25 actual) rising to $6.97 million (2026-27 budget); that tuition line also covers special education placements. [17] Ridgewood’s filing shows 147 students received from other districts in October 2024, 117 in October 2025, and 209 estimated for October 2026, with tuition revenue rising from $2.33 million to $3.68 million over the same span. [3]
The receiving-district figure identifies Ridgewood as the destination only by inference; neither filing names the other.† The high school enrollment figures above include these students.
What I tell my buyers: the number on this page that changes your cost of ownership is the levy line, not the proficiency line. The school levy is $111.7 million, it rose 4.0% this year, the benefits ratio is climbing, and the reserves that used to absorb a boiler failure are close to spent. The next capital need in this district is more likely to reach your tax bill than the last one was.
† Figures marked with a dagger are best-effort research, so verify them with the issuing office (the Village of Ridgewood, the school district, the county, the state or the utility) before making judgment calls or decisions on them.
8. Crime and Safety
Method and what the numbers are
This section reports offense counts and rates as recorded by the FBI Crime Data Explorer (CDE) for the Ridgewood Police Department (ORI NJ0025100) and four adjacent agencies, for calendar years 2021 through 2025. The CDE figures are the counts each department submitted to the FBI through the New Jersey State Police UCR program. Annual counts below are sums of the twelve monthly counts returned by the CDE summarized-data API; the CDE data was last refreshed August 15, 2026, with data through August 2026 [1].
Rates per 1,000 residents use the population the FBI assigns to each agency in the CDE for that year (stated in each table). For Ridgewood, a second set of rates is computed on the Census 2020 count of 25,979 [2]. The two denominators differ by roughly 2 to 3 percent and do not change any figure by more than 0.15 per 1,000.
Two definitions apply throughout. Violent is the sum of murder and nonnegligent manslaughter, rape, robbery, and aggravated assault. Property is the sum of burglary, larceny-theft, and motor vehicle theft. Arson is excluded from both, following FBI convention.
Counts are offenses reported to police, not convictions and not victimization surveys. A category with fewer than 30 events in a year is subject to large year-to-year swings from small numbers; every violent-crime cell in this section is in that range, and n is shown on every row.
The NIBRS transition and data gaps
The FBI retired the Summary Reporting System (SRS) and moved all agencies to the National Incident-Based Reporting System (NIBRS) effective January 1, 2021. The CDE lists NIBRS start dates for the five agencies covered here as follows: Ridgewood, January 1, 2021; Glen Rock, January 1, 2021; Wyckoff, January 1, 2021; Midland Park, August 1, 2021; Ho-Ho-Kus, October 1, 2021 [3].
Three consequences for the data:
- 2020 and earlier are SRS; 2021 onward are NIBRS. SRS applied a hierarchy rule (only the most serious offense in an incident was counted); NIBRS counts every offense in an incident. Counts across the 2020/2021 line are not strictly comparable. Ridgewood’s 2020 figures are shown for reference only.
- Months not reported are missing, not zero. Ho-Ho-Kus reported 2 of 12 months in 2021, 10 in 2022, 11 in 2023, 10 in 2024, and 12 in 2025. Midland Park reported 5 of 12 months in 2021. Wyckoff reported 11 of 12 months in 2022 and 2023. Ridgewood and Glen Rock reported all 12 months in every year 2021 through 2025. Annual figures for agencies with missing months are shown with the number of months and are not rated.
- Statewide coverage was incomplete in 2021. Agencies covering 85.3 percent of New Jersey’s population reported to NIBRS in December 2021; coverage was 96.1 percent in 2022, 95.4 percent in 2023, 98.2 percent in 2024, and 97.7 percent in 2025 [4]. Statewide rates below are computed on the participating population, not the full state population, and the 2021 statewide row should be read with the coverage figure beside it.
The New Jersey State Police publishes its own annual Uniform Crime Report with per-municipality and per-county tables. As of September 7, 2026, the most recent full-year report posted is 2023 (released April 16, 2025) and the most recent partial-year release is January through March 2024 [5]. The NJSP municipal tables are the cross-check for the FBI figures below.
Ridgewood: five-year table
Ridgewood Police Department, offenses reported, 2021 through 2025 (2020 shown for reference, SRS) [1]
| Year | Population (CDE) | Violent (n) | Property (n) | Total (n) | Violent per 1,000 | Property per 1,000 | Total per 1,000 |
|---|---|---|---|---|---|---|---|
| 2020 (SRS) | 25,036 | 8 | 135 | 143 | 0.32 | 5.39 | 5.71 |
| 2021 | 25,959 | 10 | 144 | 154 | 0.39 | 5.55 | 5.93 |
| 2022 | 26,485 | 8 | 203 | 211 | 0.30 | 7.66 | 7.97 |
| 2023 | 26,392 | 10 | 165 | 175 | 0.38 | 6.25 | 6.63 |
| 2024 | 26,864 | 12 | 157 | 169 | 0.45 | 5.84 | 6.29 |
| 2025 | 26,873 | 9 | 128 | 137 | 0.33 | 4.76 | 5.10 |
Five-year totals, 2021 through 2025: 49 violent offenses, 797 property offenses.
Same counts on the Census 2020 denominator (25,979) [2]
| Year | Violent per 1,000 | Property per 1,000 | Total per 1,000 |
|---|---|---|---|
| 2021 | 0.38 | 5.54 | 5.93 |
| 2022 | 0.31 | 7.81 | 8.12 |
| 2023 | 0.38 | 6.35 | 6.74 |
| 2024 | 0.46 | 6.04 | 6.51 |
| 2025 | 0.35 | 4.93 | 5.27 |
Composition of the violent count [1]
| Year | Murder | Rape | Robbery | Aggravated assault | Violent total |
|---|---|---|---|---|---|
| 2021 | 0 | 0 | 1 | 9 | 10 |
| 2022 | 0 | 1 | 1 | 6 | 8 |
| 2023 | 0 | 1 | 1 | 8 | 10 |
| 2024 | 0 | 0 | 2 | 10 | 12 |
| 2025 | 0 | 0 | 0 | 9 | 9 |
Composition of the property count [1]
| Year | Burglary | Larceny-theft | Motor vehicle theft | Sum of components | CDE property total |
|---|---|---|---|---|---|
| 2020 (SRS) | 9 | 115 | 9 | 133 | 135 |
| 2021 | 16 | 102 | 26 | 144 | 144 |
| 2022 | 21 | 128 | 53 | 202 | 203 |
| 2023 | 26 | 129 | 10 | 165 | 165 |
| 2024 | 16 | 129 | 12 | 157 | 157 |
| 2025 | 18 | 101 | 9 | 128 | 128 |
The CDE property-crime total exceeds the sum of its three components by 2 in 2020 and by 1 in 2022. The source of the difference is not identified in the API output. Component figures are used for composition; the CDE total is used for the rate.
Larceny-theft accounted for 71 percent of Ridgewood’s property offenses in 2021 and 79 percent in 2025.
Motor vehicle theft
Ridgewood motor vehicle thefts reported to the FBI: 9 in 2020, 26 in 2021, 53 in 2022, 10 in 2023, 12 in 2024, 9 in 2025 [1]. Within 2022, 35 of the 53 thefts were recorded in April through July (12, 8, 7, 8). No month in 2023, 2024, or 2025 exceeded 3.
Catalytic converter theft is not a separate UCR offense category. Under NIBRS it is recorded as larceny-theft (theft from motor vehicle or theft of motor vehicle parts). The CDE summarized endpoint used here does not break larceny into sub-types, so a catalytic converter series cannot be produced from this source.
Neighboring municipalities
Offenses reported and rates per 1,000, 2021 through 2025, CDE population denominators [1] [6]
| Agency | Year | Population (CDE) | Months reported | Violent (n) | Property (n) | Burglary | Larceny | MV theft | Violent per 1,000 | Property per 1,000 |
|---|---|---|---|---|---|---|---|---|---|---|
| Glen Rock | 2021 | 12,153 | 12 | 1 | 53 | 10 | 36 | 7 | 0.08 | 4.36 |
| Glen Rock | 2022 | 12,017 | 12 | 4 | 57 | 7 | 42 | 8 | 0.33 | 4.74 |
| Glen Rock | 2023 | 12,049 | 12 | 2 | 86 | 12 | 71 | 3 | 0.17 | 7.14 |
| Glen Rock | 2024 | 12,331 | 12 | 2 | 76 | 8 | 59 | 9 | 0.16 | 6.16 |
| Glen Rock | 2025 | 12,393 | 12 | 4 | 77 | 1 | 75 | 1 | 0.32 | 6.21 |
| Wyckoff | 2021 | 17,589 | 12 | 3 | 65 | 16 | 45 | 4 | 0.17 | 3.70 |
| Wyckoff | 2022 | 17,544 | 11 | 6 | 89 | 14 | 64 | 11 | not rated | not rated |
| Wyckoff | 2023 | 17,314 | 11 | 3 | 90 | 18 | 69 | 3 | not rated | not rated |
| Wyckoff | 2024 | 17,594 | 12 | 1 | 87 | 17 | 68 | 2 | 0.06 | 4.94 |
| Wyckoff | 2025 | 17,556 | 12 | 3 | 67 | 2 | 63 | 2 | 0.17 | 3.82 |
| Midland Park | 2021 | 7,481 | 5 | 0 | 11 | 3 | 8 | 0 | not rated | not rated |
| Midland Park | 2022 | 6,930 | 12 | 4 | 32 | 2 | 29 | 1 | 0.58 | 4.62 |
| Midland Park | 2023 | 6,959 | 12 | 0 | 32 | 2 | 29 | 1 | 0.00 | 4.60 |
| Midland Park | 2024 | 7,110 | 12 | 3 | 48 | 3 | 39 | 5 | 0.42 | 6.75 |
| Midland Park | 2025 | 7,122 | 12 | 2 | 49 | 1 | 46 | 2 | 0.28 | 6.88 |
| Ho-Ho-Kus | 2021 | 4,217 | 2 | 0 | 1 | 0 | 0 | 1 | not rated | not rated |
| Ho-Ho-Kus | 2022 | 4,195 | 10 | 1 | 20 | 15 | 3 | 2 | not rated | not rated |
| Ho-Ho-Kus | 2023 | 4,218 | 11 | 1 | 26 | 12 | 13 | 1 | not rated | not rated |
| Ho-Ho-Kus | 2024 | 4,320 | 10 | 3 | 11 | 5 | 6 | 0 | not rated | not rated |
| Ho-Ho-Kus | 2025 | 4,362 | 12 | 0 | 6 | 3 | 3 | 0 | 0.00 | 1.38 |
Wyckoff’s 2022 and 2023 property sums (89 and 90) equal the sum of their components for the 11 months reported. Ho-Ho-Kus’s 2022 property total (20) equals its components for 10 months. Every rate above is on a base of fewer than 18,000 residents, and every violent cell is a single-digit count.
New Jersey statewide
Offenses reported to NIBRS by New Jersey agencies, with participating-population coverage [4]
| Year | Violent (n) | Property (n) | Participating population (Dec.) | Coverage of state population | Violent per 1,000 | Property per 1,000 |
|---|---|---|---|---|---|---|
| 2021 | 12,972 | 70,484 | 7,902,553 | 85.3% | 1.64 | 8.92 |
| 2022 | 19,092 | 125,125 | 8,902,401 | 96.1% | 2.14 | 14.06 |
| 2023 | 20,225 | 137,262 | 8,861,941 | 95.4% | 2.28 | 15.49 |
| 2024 | 20,558 | 132,883 | 9,327,001 | 98.2% | 2.20 | 14.25 |
| 2025 | 18,450 | 118,071 | 9,329,469 | 97.7% | 1.98 | 12.66 |
The 2021 statewide counts are affected by the coverage gap: the monthly violent count for January 2021 (591) is less than half of January 2022 (1,417), consistent with agencies entering NIBRS during the year rather than a change in offending. Rates are computed on the December participating population because that is the denominator the FBI uses for reported-offense rates; they are not adjusted for the months in which non-participating agencies were absent.
The FBI does not publish a county-level series for municipal agencies; a Bergen County comparison will be added from the NJSP county tables.
Ridgewood Police Department: staffing
Full-time employees reported to the FBI Police Employee data collection, as of October 31 of each year [7]
| Year | Sworn officers | Civilian employees | Total | Officers per 1,000 (CDE population) |
|---|---|---|---|---|
| 2019 | 47 | 5 | 52 | 1.87 |
| 2020 | 45 | 5 | 50 | 1.80 |
| 2021 | 45 | 4 | 49 | 1.73 |
| 2022 | 48 | 5 | 53 | 1.81 |
| 2023 | 44 | 6 | 50 | 1.67 |
| 2024 | 44 | 5 | 49 | 1.64 |
| 2025 | 49 | 11 | 60 | 1.82 |
The 2025 civilian count (11) is more than double any prior year in the series (4 to 6). The FBI collection does not state whether this reflects new positions or a reclassification (for example, dispatchers moved into the police count).
The Patrol Division is organized as four squads, two day and two night, each supervised by one lieutenant and one sergeant, under a division commander at the rank of captain [8].
Fire and EMS
Staffing, budget and incident figures for the Ridgewood Fire Department and emergency medical services were not available at the time of writing; the Village budget carries them.†
† Figures marked with a dagger are best-effort research, so verify them with the issuing office (the Village of Ridgewood, the school district, the county, the state or the utility) before making judgment calls or decisions on them.
9. Living Here
This section covers what a Ridgewood address gives an owner outside the house itself: the downtown, the parks, the library, the calendar, and the distance between a front door and the train. Where the Village publishes a number, it is here. Where it does not, the gap is marked rather than filled in.
The Central Business District
Ridgewood’s downtown is the roughly 12-block commercial district centered on East Ridgewood Avenue between the NJ Transit station and Maple Avenue, with Memorial Park at Van Neste Square at its center.
Storefront count and composition. The Village does not publish a current storefront inventory.†
Vacancy. The most recent published count is from a presentation by Ridgewood Guild Executive Director Tony Damiano to the Village Council in July 2024, as reported by a local news site.47 That count is the only time series available.
| Date | Vacant CBD storefronts | Source |
|---|---|---|
| c. 2000 | 54 to 58 | Guild presentation, July 2024 (press-reported)48 |
| January 2010 | over 40 | Patch, July 201149 |
| July 2011 | just under 40 | Patch, July 201150 |
| January 2024 | 12 | Guild presentation, July 2024 (press-reported)51 |
| July 2024 | 23 | Guild presentation, July 2024 (press-reported)52 |
Two things stand out. First, vacancies nearly doubled in the first half of 2024, from 12 to 23, and I found no published count since. Second, the Village does not publish a total storefront count, so there is no vacancy rate to compare with other towns.†
The December 14, 2023 CBDAC minutes (retrieved from the Village’s archived site) record five former vacancies being re-let at once (the former Racefaster, Tabboleh, M&T Bank, Fastachi, and Town & Country spaces), and record committee concern that certificate of occupancy delays were deterring retail tenants.53 Those are the Village’s own words on turnover and they belong next to the vacancy figure.
Pedestrian plaza and dining corrals. This has been a five-year argument, and it is not settled.
- 2020 and 2021: weekend street closures and on-street dining corrals introduced during the pandemic.
- March 2022: the Council voted to remove the corrals and end the weekend closures, over restaurant objections, on the stated basis that on-street parking was more valuable to retailers than the seating was to restaurants.54
- June 3, 2023: the plaza returned as “Destination Ridgewood,” Saturdays and Sundays through October 9. On July 13 it was cut to Saturdays only. On August 3 the Village Manager suspended it for the rest of August.55
- December 2023: the CBDAC agreed to write a “lessons learned” white paper before recommending anything further to Council. The same minutes record that restaurants would not invest in corral aesthetics without year-to-year certainty that the corrals would return.56
There is no Village record of a plaza operating in 2024, 2025, or 2026.†
Parking and the Hudson Street garage. The Village bonded $12 million in July 2018, on top of $810,000 appropriated in 2014, 2015, and earlier in 2018, for a four-level, 240-space garage on Hudson Street next to the station.57 It opened November 6, 2020.58 As of the Village’s 2024 parking page, all kiosks in the garage, on street, and in lots charge $1.25 per hour; the first level is three-hour parking, levels two and three open to three-hour parking after noon, and level four is reserved for CBD employees. Enforcement runs Monday through Friday 9 am to 8 pm and Saturday 10 am to 6 pm; Sunday is free. A CBD employee hangtag is $110 per month.59 The 2018 bond was sized on a 240-space garage after voters approved a 400-space design in 2015 and rejected a 325-space alternative; the garage that got built is the smallest of the three.60
Downtown rezoning, January 2026. Five ordinances, numbered 4071 through 4075, went to the Planning Board on January 6, 2026 and to a Council public hearing on January 14, 2026. As described in the published summaries: Ordinance 4071 creates a senior overlay at North Maple, Franklin, and Marshall for an assisted-living facility of more than 100 units; Ordinance 4073 creates a commercial-residential zone on the Chestnut Street corridor at roughly 30 units per acre and 45 feet; Ordinance 4074 raises the standard density in the downtown B-1 and B-2 districts from 18 to 20 units per acre, with a targeted area at 24; and Ordinance 4075 imposes a 20% affordable set-aside on new residential development regardless of tenure.6162 These create zoning capacity; they do not approve buildings.† See the “forward-looking decisions” note at the end of this section.
Parks and recreation
Graydon Pool. Graydon is a 2.68-acre, spring-fed, sand-bottom swimming pond built in 1926 and enlarged in 1936 as a Works Progress Administration project. Preservation New Jersey placed it on its 10 Most Endangered list in 2010 after the Council considered demolishing it for a concrete pool; that plan was shelved indefinitely that year for budget reasons.63 It is not a conventional pool, and buyers who expect one should visit before they buy.
The 2026 season ran May 30 through August 30, plus September 5, 6 and 7 for Labor Day weekend, 11 am to 7 pm daily.64 New in 2026: residents 65 and over receive a complimentary membership with documentation, and shade structures were added across the facility.65
Fees, as published by the Village and reproduced by local press:
| Category | 2018 | 2023 | 2026 in-season | 2026 early bird (Apr 1 to 30) | 2026 late season (Aug 1 to Sept 1) |
|---|---|---|---|---|---|
| Resident adult (16 to 61) | $120 | $145 | $145 | $131 | $75 |
| Resident child (2 to 15) | $110 | $135 | $135 | $121 | $70 |
| Resident senior (62+) / disabled resident / caregiver | $30 (62+) | $35 | $35 | $35 | $35 |
| Non-resident adult (16+) and non-resident senior | $200 | $235 | $235 | $235 | $235 |
| Non-resident child (2 to 15) | $175 | $210 | $210 | $210 | $210 |
| Babysitter badge (18+) | $195 | $195 | $195 |
2026 figures from the Village’s Graydon Pool page (Membership 2026 Fee Schedule), retrieved September 7, 2026.66 2018 and 2023 figures from Village announcements as reproduced by The Ridgewood Blog.6768 A 3% convenience fee applies to credit card purchases of pool, tennis, pickleball, and skatepark memberships and day camp.6970 The Village page lists the resident senior badge at $35 for 2026, while the May 2026 announcement reproduced by local press described a complimentary membership for residents 65 and over with documentation; the two are reconciled only by the Recreation Department.†
Resident adult fees rose 21% between 2018 and 2023 and were held flat for 2026. Non-resident fees rose 18% and were also held flat. Under Village Code, use of the pool is limited to residents, their guests, and Village and school district employees; a 2007 provision that had admitted residents of adjoining towns expired September 3, 2012.71
Memorial Park at Van Neste Square. The downtown green at East Ridgewood Avenue and Broad Street. It is the site of the Chamber’s car show, the December tree lighting, and the summer concert series. No acreage is published.
The Duck Pond. The Wild Duck Pond area on East Ridgewood Avenue is a Bergen County facility, part of the 577-acre Saddle River County Park. It has picnic areas, an electric pavilion (permit required), an ADA-accessible playground, a dog park, fishing (state license required), permitted model boating, and ice skating when conditions allow. The county’s multi-use path through the park is about 6 miles long and runs through Ridgewood, Glen Rock, Fair Lawn, Paramus, Saddle Brook, and Rochelle Park.72 The county, not the Village, maintains it; Ridgewood taxes pay for it only through the county levy.
Athletic fields. Veterans Field (131 North Maple Avenue, behind Village Hall) is the Village’s principal field complex and the venue for the July 4 fireworks and the Ridgewood Run start.7374†
Ridgewood Public Library. 125 North Maple Avenue, 34,000 square feet, adjacent to Village Hall and Veterans Field. Hours as of September 2026: Monday through Thursday 9 am to 9 pm, Friday 9 am to 6 pm, Saturday 9 am to 5 pm, Sunday 1 pm to 5 pm.75
The renovation was funded privately rather than by Village bond. A $500,000 gift from the Ridgewood Public Library Foundation paid for the first phase beginning June 2023: a teen room 60% larger, seven reservable mezzanine study rooms (six for up to four people, one for up to ten), a new lobby, and a repositioned first-floor service desk.76 A $1 million legacy gift from the Bolger Foundation, announced April 2023, funded the auditorium and the technology training room.77 In September 2025 the Friends and the Foundation merged into a single Friends Foundation of the Ridgewood Public Library.78 The library has adopted a 2026 to 2029 Strategic Plan.79 Trustees meet the third Tuesday of each month at 7:30 pm, no August meeting.80†
Farmers market
Operated by the Ridgewood Chamber of Commerce, not the Village. Sundays, 8:30 am to 2 pm, in the west-side parking lot of the train station. The 2024 season ran June 23 through October 27; the 2025 season opened June 22; the 2026 season opened June 28 and was still listed on the Chamber calendar for September 6, 2026.8182†
Youth sports
Registration for Village-run programs and for the Ridgewood Soccer Association runs through the Community Pass platform.83
| Organization | Type | What is published |
|---|---|---|
| Ridgewood Soccer Association | Independent nonprofit, founded 1978 | “Over 1,200 children participating annually”; Kinderkickers (ages 4 to 6), in-town rec (grades 1 to 4), rec travel (grades 5 to 12), adult, referee, and unified programs; fees rise $25 after June 1 for fall registration84 |
| Ridgewood Baseball/Softball Association (RBSA) | Independent | † |
| Ridgewood Maroons Lacrosse | Independent | † |
| Ridgewood Junior Football Association (RJFA) | Independent | † |
| Village Recreation Department | Municipal | Sports camps (golf, multisport, lacrosse, tennis, T-ball), summer day camp, aquatics, tennis, pickleball, skatepark85 |
The annual calendar
| Event | 2025 to 2026 date | Organizer | Notes |
|---|---|---|---|
| Ridgewood Run | Monday, May 25, 2026 (49th running) | North Jersey Masters Running Club | 10K, 5K, Memorial Mile, Fun Run; starts at Veterans Field; 2026 10K was the USATF-NJ Masters Men’s Championship; all races have a push-rim wheelchair division86 |
| Farmers market | Sundays, June 28 to fall 2026 | Chamber of Commerce | See above |
| Fourth of July | Saturday, July 4, 2026 (116th) | Ridgewood Fourth of July Celebration, Inc. | Flag raising 9 am at Wilsey Square; parade 10 am from Monroe Street and Godwin Avenue through the CBD; evening program at Veterans Field from 6 pm with ticketed fireworks. The 2026 fireworks were cancelled for severe weather and tickets were not refunded. The committee is a private, all-volunteer nonprofit that “receives no funding from the Village.”8788 |
| Chamber car show | September 5, 2025 (33rd); 2026 date† | Chamber of Commerce | 6 pm to 9 pm, East Ridgewood Avenue and Van Neste Square89 |
| Downtown for the Holidays tree lighting | Friday, December 5, 2025 (40th) | Chamber of Commerce with the Village | 54-foot tree at Van Neste Square; the December 2023 event drew “over 2,000 people” in rain per CBDAC minutes9091 |
| Guild events | Various | Ridgewood Guild (501(c)(6), founded February 2010) | Film festival, Music in the Night, Movies in the Park, Art in the Park, Fall Harvest Marketplace, Winterfest, Pride Marketplace; 30% of members are residents92 |
The Chamber reports “over 300 members.”93 A private nonprofit funding the town’s signature event from ticket sales, and cancelling it without refunds when weather intervenes, is the arrangement; it is not a Village service and should not be described as one.
Distance to the station
Ridgewood station (Garber Square) averaged 1,228 weekday boardings in 2025, 26th of 153 NJ Transit stations.94 The table gives straight-line distance from a fixed public address in each area to the station. Straight-line understates walking distance, typically by 15% to 30% on Ridgewood’s street grid, and does not account for grade. These are distances, not judgments.
| Area | Anchor address used | Straight-line miles to station |
|---|---|---|
| Village Hall / Veterans Field / Library | 131 N Maple Ave | 0.43 |
| Heights | 300 Heights Rd | 0.57 |
| Orchard / West Side | Orchard School, 230 Demarest St | 0.66 |
| Travell area | Travell School, 340 Bogert Ave | 1.00 |
| Glen area (east) | 500 E Glen Ave | 1.14 |
| Willard area | Willard School, 601 Morningside Rd | 1.20 |
| Somerville area | Somerville School, 100 Somerville Rd | 1.32 |
| Upper Ridgewood / Habernickel | 1100 Hillcrest Rd | 1.74 |
Coordinates from the U.S. Census Bureau geocoder; station coordinates 40.9807 N, 74.1205 W; haversine calculation by Ashish Desai Group, September 7, 2026.95†
What I tell my buyers: the number on the Graydon badge is not the number to watch. The one to watch is the CBD ordinance file. If 4073 and 4074 were adopted as introduced, the Chestnut Street corridor and the downtown B zones can now carry 30 and 24 units per acre respectively, at 45 feet. That is not a building; it is the right to propose one, and the first proposals will arrive inside the holding period of anyone buying this year.
† Figures marked with a dagger are best-effort research, so verify them with the issuing office (the Village of Ridgewood, the school district, the county, the state or the utility) before making judgment calls or decisions on them.
10. Housing Pipeline and the Fourth Round
The number that matters is not 427
In October 2024 the New Jersey Department of Community Affairs assigned every municipality a fourth-round affordable housing obligation covering 2025 through 2035. Ridgewood’s figures: a present need (rehabilitation) obligation of 4 units and a prospective need of 427 units.96
That 427 is the number that circulated in town. It is not the number the Village has to build.
New Jersey’s Fair Housing Act lets a municipality with no developable land apply a Vacant Land Adjustment, which splits the obligation into two parts: a Realistic Development Potential (RDP), which the town must actually deliver, and an unmet need, which the town must address through zoning that creates the opportunity for affordable units if and when property owners redevelop. Ridgewood has used this mechanism since its first-round plans; a state site visit in 2002 found the Village “fully developed with the exception of park and recreation areas,” and the adopted plan repeats that finding.97
The adopted fourth-round plan works out as follows.
| Item | Units | Source |
|---|---|---|
| DCA fourth-round prospective need | 427 | DCA report, App. A p. 22 |
| DCA present need (rehabilitation) | 4 | DCA report, App. A p. 22 |
| Obligation fixed by court order, May 19, 2025 | 427 prospective / 0 rehabilitation | HEFSP p. 11 |
| Fourth-round RDP (one site: 299 Goffle Road, 1.62 ac at 13 du/ac = 4.21) | 4 | HEFSP p. 24 |
| Fourth-round unmet need (427 minus 4) | 423 | HEFSP p. 26 |
| Credits applied against the 4-unit RDP | 16 | HEFSP p. 25 |
| Surplus credits | 12 | HEFSP p. 25 |
The Village committed to the DCA numbers by resolution on January 29, 2025; the plan does not state a resolution number.98 No party objected to the Village’s numbers and on May 19, 2025 Judge Gregg A. Padovano, J.S.C., entered an order fixing them, with the rehabilitation figure set at zero rather than DCA’s four.99
The Planning Board adopted the 2025 Fourth Round Housing Plan, Housing Element & Fair Share Plan (Kyle + McManus Associates; Elizabeth McManus, PP, AICP) on June 23, 2025, and the plan was filed with the Superior Court under docket BER-L-000777-25 on July 1, 2025.100 That met the statutory June 30, 2025 deadline. The Council’s endorsing resolution date is not stated in the filed plan.†
Where the 16 credits came from
The four-unit RDP was satisfied entirely by units that already exist. No new construction was needed.
| Project | Address | Total units | Affordable | Credits toward 4th-round RDP | Status |
|---|---|---|---|---|---|
| The Enclave (257 Ridgewood Avenue, LLC) | 257 E. Ridgewood Ave. at N. Maple, 1.37 ac | 40 (32 market, 8 special-needs) | 8 special-needs homes / 15 bedrooms | 1 | Built |
| Ridgewood Dayton | 100–152 S. Broad St., 2.67 ac (former Brogan Cadillac) | 93 (79 market, 14 affordable rental) | 14 | 7 + 1 bonus = 8 | Built |
| Two Forty Associates (marketed as Chestnut Village) | 150–174 Chestnut St., 1.246 ac | 42 (35 market, 7 affordable rental) | 7 | 7 | Built |
| Total | 16 |
Source: HEFSP pp. 19–25.101 The Enclave and Ridgewood Dayton also supplied credits to the prior rounds; the fourth-round column counts only the units not previously used.
The fourth project from the 2015–2020 litigation, KS Broad Street, LLC (76–80 Chestnut St., 2.01 ac, marketed as The Benjamin at 1 Franklin Ave.), is 60 mixed-use rental units. Its 9 affordable units were provided off-site at The Enclave and, with 9 special-needs bonus credits, counted fully toward the prior rounds (18 credits). It contributes nothing to the fourth round.102103
For context: the four buildings together added 235 apartments to Ridgewood between roughly 2019 and 2023, of which 30 are deed-restricted affordable (the Enclave’s special-needs bedrooms counted separately). That is the entire multifamily pipeline of the last decade.
What the 423 unmet need actually commits the Village to
An unmet need is not a construction requirement. It is a zoning requirement: the Village must adopt districts and overlays that would produce affordable units if owners redevelop. The prior-round plan carried an unmet need of 838 units and addressed it with downtown density (B-1/B-2 at 18 du/ac), an AH-3 zone on Ridge Road, B-3 zones on North Maple and Goffle Road, a Valley Hospital redevelopment overlay, and a villagewide mandatory set-aside. The 2025 plan states, for each of the first four, that “this strategy has not yielded affordable homes,” and adds that “little substantial redevelopment has occurred or been requested” downtown since the zoning was adopted.104
The fourth-round plan proposed five new or amended mechanisms, projected in the plan at 354 anticipated affordable units:105
| Mechanism | Area | Density / set-aside | Plan’s anticipated affordable units |
|---|---|---|---|
| S-1 Senior Overlay (Kensington assisted living) | Block 3611, Lots 1, 19, 22; N. Maple / Franklin / Marshall, 1.25 ac | ~125 beds, 10% of beds | ~12 |
| C-R-1 Chestnut Street district | 4.18 ac; body shop, bakery, Village Street Department, pet supply | 30 du/ac, 20% | 25 |
| B-1 / B-2 downtown (amended) | 78.25 ac | 18 to 20 du/ac; 15% to 20% | 313 |
| TO-1 Townhouse Overlay, 299 Goffle Road | 1.62 ac, previously R-2 | 13 du/ac, 20% | 4 (this is the RDP site) |
| Villagewide mandatory set-aside (amended) | Any 5+ unit multifamily via variance, rezoning or redevelopment | 20% regardless of tenure | n/a |
What happened next: Ordinance 4052, two challenges, and a settlement
The plan’s ordinances had to be adopted for the plan to hold. The first to move was Ordinance 4052, creating the S-1 Senior Overlay for the Kensington site. The Planning Board reviewed it on July 15, 2025, found it “not inconsistent with the 2022 Master Plan” and “consistent with the Housing Element and Fair Share Plan,” and recorded a permitted height of 56 feet and 85% impervious coverage.106 The Village Council did not adopt it on August 13, 2025.107 The Village’s August 13, 2025 Council minutes exist on the Agenda Center and record that the Mayor moved the public hearing on Ordinance #4052 ahead of public comments;†
The statute gave interested parties until August 31, 2025 to challenge the plan. Two did. Ordinance 4071, later introduced by the Council, recites a “2025 Settlement Agreement between the Village of Ridgewood and Kensington Senior Living, LLC” resulting from mediation of a challenge filed by Kensington Senior Development, LLC in the Affordable Housing Dispute Resolution Program.108 Ordinances 4072 through 4075 each recite a “2025 Mediation Agreement between the Village of Ridgewood and Fair Share Housing Center.”109 The Fair Share Housing Center mediation agreement raised the 299 Goffle Road density from the 13 du/ac in the plan to 15 du/ac.110
The Council introduced replacement ordinances on December 17, 2025, with hearings January 14, 2026:111112
| Ordinance | What it does | Key standards |
|---|---|---|
| 4071 | S-1 Senior Overlay, Block 3611 Lots 1, 19, 22 | Assisted living; 50 ft height; 10% of beds affordable, 40-year controls |
| 4072 | TO-1 Townhouse Overlay, 299 Goffle Road | 15 du/ac; 3 stories / 40 ft; 20% set-aside |
| 4073 | C-R-1 Commercial-Residential, Chestnut St. (Block 1912 Lot 8; Block 2001 Lots 1, 2, 13–19; Block 2005 Lots 1, 2) | 30 du/ac; 45 ft; 20% set-aside |
| 4074 | B-1 / B-2 amendments | 18 to 20 du/ac; 24 du/ac on west side of S. Broad St. outside the historic district; 20% set-aside |
| 4075 | Mandatory set-aside, §190-128.2 | 20% for all residential units regardless of tenure (was 15% rental / 20% sale) |
Each ordinance states its purpose is “to implement the Housing Plan, secure a Compliance Certification, and to ensure immunity from builder’s remedy litigation.”113 The Council adopted all five at its meeting that began February 11, 2026.114†
As of September 7, 2026, whether the Village filed an amended plan by the March 15, 2026 statutory deadline, and whether a compliance certification has issued, is the open question.†
Planning Board applications and other Village sites
No application under the new overlays has yet been heard by the Planning Board. The Kensington site (currently office use) still requires site plan approval before construction.115†
The C-R-1 district includes the Village Street Department yard on Chestnut Street (the “Town Garage”).116 Whether the Village intends to sell or redevelop that parcel is not stated in the plan. The Valley Hospital campus at 223 N. Van Dien Ave. remains under a redevelopment overlay permitting 13 du/ac with a 40-unit affordable minimum; the plan notes the hospital “has vacated the property” but “there remain some medical related uses.”117 No housing-related site plan for Ridgewood Water facilities or the Schedler property appears in the housing plan; both are outside its scope.
What this means for owners, two to three years out
Ridgewood will not see a court-ordered high-density project on the strength of the fourth-round obligation alone. The RDP of 4 is satisfied by 16 credits from buildings that already stand, with 12 in surplus. The zero rehabilitation obligation means no rehab program. The plan carries protection through July 2035 if compliance certification issues, with a 2030 midpoint review.118
The exposure is the unmet need, and it is now zoned. The 423 units are addressed by overlays that let owners build if they choose, at 20 to 30 du/ac downtown and on Chestnut Street, 15 du/ac on Goffle Road, and a 125-bed assisted-living building at North Maple and Franklin. The plan’s own projection is 354 affordable units from those mechanisms, which at a 20% set-aside implies on the order of 1,700 market-rate units if every eligible parcel redeveloped. The prior-round record says that will not happen quickly: the same downtown strategy at 18 du/ac produced no affordable units in five years. But the zoning is permanent, the density is higher, and the set-aside applies to any project of five or more units that needs a variance, rezoning, or redevelopment designation anywhere in the Village.
Builder’s remedy. Immunity from builder’s remedy suits depends on the compliance certification, which in turn depends on the ordinances being adopted (done) and the amended plan being accepted (unconfirmed above). If certification issued, a developer cannot use the fourth-round obligation to force a project onto an unzoned site before 2035. If it did not, the surplus credits are irrelevant to that question.
Where future units would go. Chestnut Street between the Street Department and the tracks; the west side of South Broad Street; the Kensington corner; 299 Goffle Road; and, at 13 du/ac, the former Valley Hospital campus. Owners on those blocks, and on the residential streets abutting them (Marshall Street, Franklin Avenue, Goffle Road, Van Dien Avenue), hold the properties most affected by the February 2026 ordinances.
What I tell my buyers: the “427 units” headline and the “4 units” headline are both true and both misleading. What changed in February 2026 is the zoning map, not a construction schedule. Look at the map before you buy near Chestnut Street or the North Maple / Franklin corner.
† Figures marked with a dagger are best-effort research, so verify them with the issuing office (the Village of Ridgewood, the school district, the county, the state or the utility) before making judgment calls or decisions on them.
11. Zoning and What You Can Build
Ridgewood does not regulate house size with a conventional floor-area ratio. It uses a sliding schedule called “gross building area,” set in 2007, layered on top of three other caps (building coverage, improvement coverage, and height in feet and stories) and a front setback that floats with the neighbors. Which cap binds first depends almost entirely on lot size. This section lays out the numbers, works two typical lots, and explains what happens when a plan exceeds them.
Everything below is from Chapter 190 of the Village Code as published on eCode360, which carried legislation through Ordinance No. 4099 (adopted July 15, 2026) as of September 7, 2026.119 A section number is given for every figure.
The residential districts
Single-family zones are named for their minimum lot size. R-125 means 25,000 square feet, R-110 means 19,250, R-1 means 14,000, R-2 means 10,500. R-3 is the only zone where a two-family house is a permitted use. R-1A and R-2A borrow the R-1 bulk table and exist to allow cluster and attached-unit options.120
Table 11.1. Bulk standards, single-family and two-family zones. As of September 7, 2026.
| Standard | R-125 (§190-100) | R-110 (§190-101) | R-1 / R-1A / R-2A (§190-102, -103, -105) | R-2 (§190-104) | R-3 (§190-106) |
|---|---|---|---|---|---|
| Minimum lot area, interior lot | 25,000 sf | 19,250 sf | 14,000 sf | 10,500 sf | 8,400 sf |
| Minimum lot area, corner lot | 31,000 sf | 22,750 sf | 16,800 sf | 14,700 sf | 12,600 sf |
| Minimum lot width at front setback line | 125 ft | 110 ft | 100 ft | 75 ft | 60 ft |
| Minimum lot depth | 160 ft | 140 ft | 120 ft | 120 ft | 120 ft |
| Front yard | 50 ft or mean prevailing | 40 ft or mean prevailing | 40 ft or mean prevailing | 40 ft or mean prevailing | 40 ft or mean prevailing |
| Side yard, each | 20 ft | greater of 15 ft or 2/3 building height | greater of 15 ft or 2/3 building height | 10 ft | 10 ft |
| Both side yards combined | 33% of lot width | 33% of lot width | 33% of lot width | 33% of lot width | 33% of lot width |
| Rear yard | 40 ft | 40 ft | 30 ft | 30 ft | 30 ft |
| Maximum height | 30 ft and 2.5 stories | 30 ft and 2.5 stories | 30 ft and 2.5 stories | 30 ft and 2.5 stories | 30 ft |
| Coverage by above-grade structures | 20% | 20% | 20% | 20% | 25% |
| Coverage by improvements | §190-119H | §190-119H | §190-119H | §190-119H | §190-119H |
| Gross building area | §190-119J | §190-119J | §190-119J | §190-119J | §190-119J |
Three rules cut across the table:
- Height above 30 feet. The single-family zones allow up to 35 feet only if the lot is at least 75 feet wide, the roof pitch is 8:12 or steeper, and the height does not exceed 150% of the shallowest side yard.124 That last condition is the one that matters. A 35-foot house needs a side yard of at least 23.3 feet. In R-2, where the minimum side yard is 10 feet, the practical cap is 30 feet unless the house is pushed far off one line.
- Height is measured from average finished grade within 15 feet of the building’s base, not from the lowest point.125 Regrading around a foundation changes the number.
- Front setback floats. Since November 2023 (Ord. No. 3973), if the mean prevailing setback on the block differs from the 40-foot minimum by five feet or more in either direction, the new front wall must sit within two feet of the block’s mean.126 On streets where houses sit at 28 feet, a new house cannot be set at 40; on streets where they sit at 55, it cannot be set at 40 either.
The gross building area schedule
This is the part that matters for anyone planning an addition or a teardown. Gross building area counts every story and half-story of the principal building and accessory buildings, measured to the outside of the exterior walls, including attics with seven feet or more of clearance, stairwells, enclosed porches, and attached garages. It excludes unenclosed porches, space under seven feet, and most basements (a basement counts where it projects beyond the upper floor footprint and sits three feet or more above grade).127
Table 11.2. Maximum gross building area, §190-119J. Limit is the lesser of the percentage or the square-foot cap. As of September 7, 2026.
| Lot area (sf) | Single-family principal building | Two-family principal building | Detached accessory buildings |
|---|---|---|---|
| 0 to 8,399 | 35%, not above 2,856 sf | 40%, not above 3,276 sf | 7.5%, not above 588 sf |
| 8,400 to 10,499 | 34%, not above 3,360 sf | 39%, not above 3,675 sf | 7.0%, not above 682 sf |
| 10,500 to 13,999 | 32%, not above 4,060 sf | 35%, not above 4,060 sf | 6.5%, not above 840 sf |
| 14,000 to 19,249 | 29%, not above 4,620 sf | 29%, not above 4,620 sf | 6.0%, not above 962 sf |
| 19,250 to 24,999 | 24%, not above 5,000 sf | 24%, not above 5,000 sf | 5.0%, not above 1,000 sf |
| 25,000 and up | 20% | 20% | 4.0% |
Source: eCode360, §190-119J, retrieved September 7, 2026.128 The square-foot caps are set so that each tier’s ceiling equals the next tier’s percentage applied to the next tier’s floor; the schedule is continuous.
Table 11.3. Maximum coverage by improvements, §190-119H(1). Includes buildings, driveways, walks, patios, pools and any paved surface. As of September 7, 2026.
| Lot area (sf) | Maximum coverage |
|---|---|
| 0 to 13,999 | 45%, not above 5,600 sf |
| 14,000 to 24,999 | 40%, not above 8,750 sf |
| 25,000 and up | 35% |
Source: eCode360, §190-119H, as amended by Ord. No. 3973 (November 8, 2023).129 Both coverage tests are applied twice, once to the whole lot and once to the portion within 140 feet of the front lot line (175 feet in R-110, 200 feet in R-125), so a deep lot cannot bank rear acreage to justify a larger front.130
How the code got here
The layered structure is the product of four amendments, each a response to what builders did under the previous one. Ordinance No. 3083 (October 10, 2007) introduced the gross building area schedule. Ordinance No. 3120 (May 14, 2008) rewrote the height measurement and the 2.5-story limit. Ordinance No. 3591 (April 12, 2017) added the improvement-coverage caps, reaching driveways and patios the 2007 rule had missed. Ordinance No. 3973 (November 8, 2023) added the floating front setback and the within-140-feet coverage test; Ordinance No. 3980 (January 17, 2024) adjusted the R-3 front yard.131132 The five February 11, 2026 ordinances (Nos. 4071 through 4075) are about affordable housing overlays, not single-family bulk, and are covered below.133 The subject of Ordinance No. 4099 (July 15, 2026) is†.
Two lots, worked
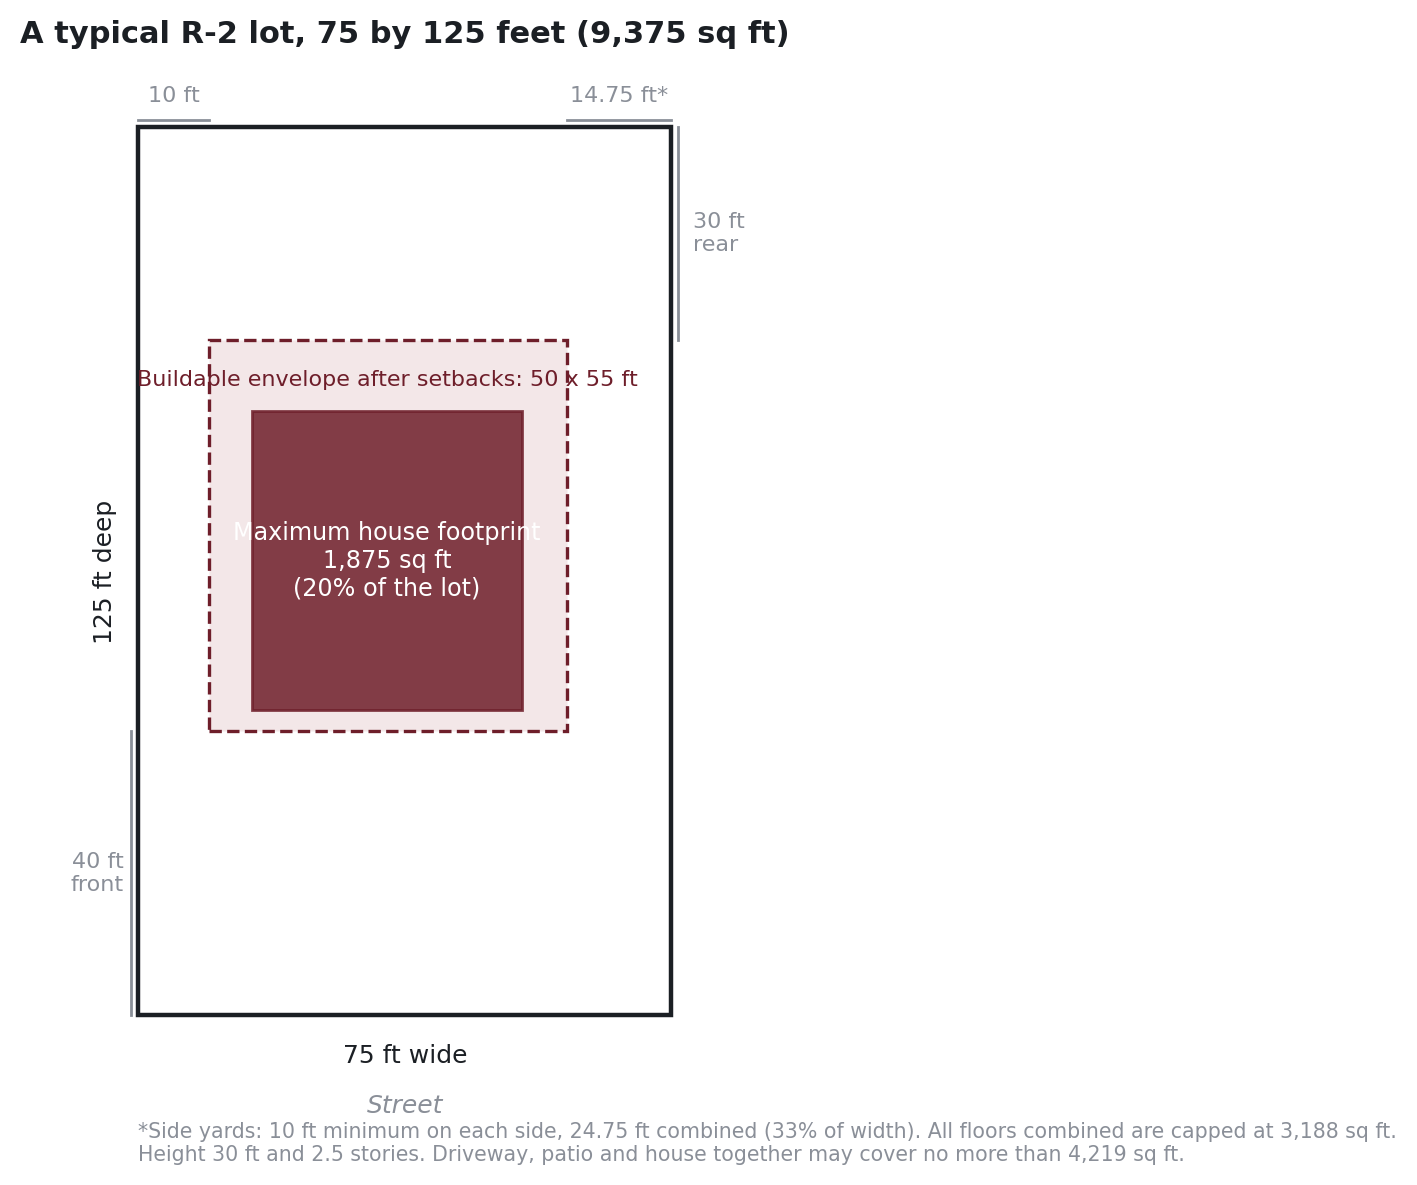
A 75 by 125 lot in R-2 (9,375 sf). This lot meets the 75-foot width but not the 10,500 sf minimum, which is the ordinary condition in the R-2 neighborhoods east and west of the tracks. It is a pre-existing nonconforming lot under §190-127 and can be built on, but its undersize is the first line of every variance application it will ever file.
| Cap | Arithmetic | Limit |
|---|---|---|
| Gross building area, principal | 34% of 9,375 (cap 3,360) | 3,188 sf all floors, including attached garage and any attic with 7 ft clearance |
| Gross building area, detached accessory | 7% of 9,375 (cap 682) | 656 sf |
| Coverage by above-grade structures | 20% of 9,375 | 1,875 sf footprint, including porches, decks and steps |
| Coverage by improvements | 45% of 9,375 (cap 5,600) | 4,219 sf including driveway and patio |
| Buildable width | 75 ft less 24.75 ft combined side yards (10 ft minimum on one side) | 50.25 ft |
| Buildable depth | 125 ft less 40 ft front (or mean prevailing) less 30 ft rear | 55 ft |
| Height | 30 ft / 2.5 stories; 35 ft only if shallowest side yard is 23.3 ft or more | 30 ft in practice |
Take an existing 1920s colonial on that lot: 1,000 sf footprint, two full stories, a 400 sf attached garage, a 100 sf open front porch. Gross building area is roughly 2,400 sf; footprint coverage is 1,500 sf.
- Dormer. A shed dormer that creates 400 sf of attic with seven-foot clearance consumes 400 sf of the 788 sf of remaining gross building area and changes nothing else. It is permitted as of right. The trap is the half-story definition: if the attic floor area with a seven-foot ceiling exceeds one-third of the floor below, the attic becomes a third story, and the house is at three stories against a 2.5-story cap.134 On a 1,000 sf floor plate, 333 sf of seven-foot attic is the line.
- Full second story on a cape. Swap the colonial for a 1,100 sf cape with a partial second floor (say 2,000 sf existing gross building area). Adding 600 sf to finish the second floor lands at 2,600 sf, inside the 3,188 sf cap, with no change in footprint. Permitted as of right, unless the existing side walls sit inside the 10-foot side yard, which many 1950s capes do. Building up on a nonconforming wall is an expansion of a nonconforming structure under §190-126 and needs a variance.135
- Rear addition. The colonial has 375 sf of footprint coverage left (1,875 less 1,500). A one-story 16 by 24 family room (384 sf) is over by 9 sf. A two-story 16 by 24 addition is over on coverage and adds 768 sf of gross building area against 788 sf remaining. On this lot the binding constraint is the 20% footprint rule, not the gross building area schedule, and a coverage variance is the ordinary outcome of a rear addition on a 9,375 sf R-2 lot.
A 50 by 100 lot in R-3 (5,000 sf). Also nonconforming (8,400 sf and 60 ft minimums). The numbers are tight:
| Cap | Arithmetic | Limit |
|---|---|---|
| Gross building area, single-family | 35% of 5,000 | 1,750 sf all floors |
| Gross building area, two-family | 40% of 5,000 | 2,000 sf |
| Coverage by above-grade structures | 25% of 5,000 | 1,250 sf |
| Coverage by improvements | 45% of 5,000 | 2,250 sf |
| Buildable width | 50 ft less 16.5 ft combined side yards | 33.5 ft |
| Buildable depth | 100 ft less 40 ft front less 30 ft rear | 30 ft (more where mean prevailing setback is shorter) |
A 1,750 sf ceiling on all floors combined means a conforming two-story house has a footprint of 875 sf including the garage. Most existing houses on 5,000 sf lots already exceed that. On these lots, every addition of any size, including a dormer, is a gross building area variance, and the 30-foot buildable depth means the floating front setback (§190-119A) is doing real work: on a block where houses sit at 25 feet, buildable depth rises to 45 feet.
c-variance or d-variance
New Jersey’s Municipal Land Use Law sorts variances into two classes, and the class determines the vote, the standard of proof, and the odds.136
- “c” (bulk) variances, N.J.S.A. 40:55D-70c: setbacks, coverage, lot size, stories, and height up to a threshold. Granted on a showing of hardship (c(1)) or that the benefits outweigh the detriments (c(2)). Simple majority of the Zoning Board of Adjustment. Decision required within 120 days of a complete application.
- “d” variances, N.J.S.A. 40:55D-70d: use, density, height exceeding the maximum by more than 10 feet or 10%, and floor area ratio. Require “special reasons,” a five-of-seven affirmative vote, and a showing that the grant does no substantial detriment to the zone plan. Decision required within 120 days.
Whether an overage on Ridgewood’s gross building area schedule is treated as a d(4) floor-area-ratio variance (five votes, special reasons) or as a c variance is the single most consequential procedural question for an owner on a small lot, and the code does not say.†.
A house that stays under 30 feet and 2.5 stories but exceeds coverage or a side yard is a c variance. A house at 33 feet in R-2 is still a c variance (under the 10-foot/10% threshold). A third full story, a two-family use in R-2, or an accessory apartment anywhere is a d variance. Application fees and escrow deposits are in Chapter 145 of the Code;†.
The Zoning Board record, September 2025 through August 2026
The next edition of this report will tabulate every application the Zoning Board of Adjustment heard in the prior twelve months by variance type and outcome, with the time from filing to decision.137
The Board met on January 13, January 27, February 10, February 24, March 10, March 24, April 14, April 28, May 12, May 26, June 9, June 23, July 28, August 11 and August 25, 2026 (July 14 was canceled), with September 8 and September 29 scheduled, and the Village posts a full court-reporter transcript for at least some hearings (for example, the June 23, 2026 transcript for the West Side Presbyterian Church application, DocumentCenter View 7069). Agendas and minutes are served only as PDFs (for example, https://www.ridgewoodnj.net/AgendaCenter/ViewFile/Agenda/_08252026-1474 and …/ViewFile/Minutes/_06232026-1438). Two applications on the 2026 docket: 174 S Maple Avenue (site plan and architectural submittal with a “Reasons for Relief” statement dated January 23, 2026) and the Family of Caring at Ridgewood site plan at 304 South Van Dien (engineering review May 20, 2026, flood hazard plan included).†
What the code itself predicts, pending the count: on R-2 lots below 10,500 sf the recurring variance will be coverage by above-grade structures; on R-3 lots below 8,400 sf it will be gross building area.
Trees
Chapter 260 was repealed and re-adopted as Ordinance No. 4043 on April 9, 2025.138 The operative rules for a homeowner:
- A permit is required to remove any non-invasive tree of 8 inches or more in diameter at breast height on private property. There is no annual free allowance.
- Exempt: trees certified dead, dying or diseased by a licensed tree expert; hazard trees confirmed by the expert and the Village Arborist; listed invasive species.
- Replacement for a home improvement project: one tree per tree removed, minimum 1.75 inches caliper, deciduous for deciduous and conifer for conifer.
- Replacement for development (a new house, a subdivision): 1 tree for 8 to 13 inches, 2 for 13 to 23, 3 for 23 to 33, 4 above 33 inches. Where the lot cannot hold the replacements, a contribution in lieu is paid at the rate in Chapter 145.
- A tree removal permit must accompany any Planning Board, Zoning Board, building or engineering application that proposes removing a qualifying tree. Sidewalk or driveway work that disturbs roots needs written authorization from the Village Arborist first.
- Minimum penalty $500 per offense, and the court may order replanting at the violator’s cost.
Permit fee and in-lieu contribution amounts: not available at the time of writing.† For a teardown on a wooded 0.4-acre lot the replacement schedule is a real line item: six 20-inch trees removed means twelve replacements or the in-lieu payment for whatever will not fit.
Historic preservation
Review by the Historic Preservation Commission is narrow. Under §190-97D it applies only to properties inside a designated historic district or on a designated historic site, not to any house of a given age.139 The Village has one district, the Village Center Historic District, and a list of 43 designated block-and-lot sites, nearly all of them in blocks 3701 through 3811, which is the downtown core; three listed sites (Blocks 2005, 2114 and 2201) sit outside it.140 For those properties the Construction Official must refer demolition, relocation, any exterior change visible from a public street, and any new construction to the Commission, which has 45 days to report; silence is deemed approval; a negative report requires denial or conditions; and a denied demolition can still proceed as of right after an appeal to the Zoning Board, a six-month notice period and a bona fide offer to sell.141 The Commission applies the Secretary of the Interior’s Standards for Rehabilitation.142
What matters for the residential market is what is absent: no demolition-delay ordinance, no age trigger, no design review for single-family houses outside the Village Center. A 1910 house on a residential street can be demolished on a Uniform Construction Code permit with no discretionary review, subject only to the tree ordinance and the bulk table for its replacement.†.
Teardown economics
The cleanest evidence is in the deed record itself. Bergen County deed data for Ridgewood (NJ Property Records export, 2,875 recorded transfers January 2021 through August 2026, merged and de-duplicated by block, lot and sale date) contains 56 properties that sold twice in the window with the second price at least 1.8 times the first. Thirty-six of the 56 second sales carry the county’s non-usable code 07, which the Division of Taxation reserves for a property “substantially improved subsequent to assessment,” and eight show a year built of 2021 or later on the current tax record. These are teardowns and gut renovations, identified by the assessor rather than by a listing description.
Table 11.4a. Repeat sales at 1.8x or more, Ridgewood, deeds recorded 1/2021 to 8/2026. Analysis by Ashish Desai Group from Bergen County deed records; as of September 7, 2026.
| Subset | n | Median first purchase | Median resale | Median multiple | Median months held | Median gross spread |
|---|---|---|---|---|---|---|
| All repeat sales at 1.8x or more | 56 | $621,500 | $1,527,500 | 2.52x | 13.4 | $878,000 |
| Second sale coded NU-07 (substantially improved) | 36 | $581,000 | $1,456,000 | 2.54x | 13.0 | $857,500 |
| Year built 2021 or later (confirmed new build) | 8 | $692,500 | $2,030,000 | 2.71x | 18.2 | $1,350,000 |
| Resold in 2025 or 2026 | 23 | $675,000 | $1,902,500 | 2.67x | 24.4 | $1,225,000 |
| R-2 zone | 32 | $597,000 | $1,456,000 | 2.42x | 12.8 | $832,500 |
| R-1, R-110 and R-125 zones | 20 | $655,000 | $1,595,000 | 2.66x | 14.5 | $926,000 |
The gross spread is resale minus lot purchase and says nothing about construction cost, carry, or commission; a 3,500 square foot new build in Bergen County in 2025 and 2026 plausibly consumes most of a $1.0 million spread and a good part of a $1.35 million one. What the table establishes is the entry price: a Ridgewood lot with an obsolete house cost a median of roughly $600,000 to $700,000 across 2021 to 2025, and the resale of what replaced it has moved from a median of $1.46 million on the full set to $1.90 million on 2025 to 2026 resales. The largest confirmed pairs in the record: 473 Cambridge Rd ($558,000 in October 2022 to $2,798,000 in July 2025, year built 2023); 20 N Pleasant Ave ($750,000 in March 2025 to $2,600,000 in January 2026, year built 2025); 856 Hillcrest Rd ($660,000 in January 2021 to $2,920,000 in July 2026); 425 Overbrook Rd ($750,000 in November 2022 to $2,915,000 in May 2025, NU-07).
The cross-check below was assembled earlier from Redfin listing pages, which reproduce NJMLS and county deed data. Where the two sources overlap (276 Van Emburgh, 326 Northern Pkwy, 473 Cambridge, 219 Brookside, 383 Stevens, 20 N Pleasant) the deed record matches the listing figures to the dollar. Redfin is a consumer site; each figure there is flagged for re-verification against the Bergen County Clerk deed and the NJ Division of Taxation SR-1A sales record before publication.
Table 11.4. Six Ridgewood teardown pairs, lot purchase and new-house resale. As of September 7, 2026.
| Address | Lot (sf) | Old house bought | New house sold | Year built | New GBA (sf, listing) | Multiple |
|---|---|---|---|---|---|---|
| 276 Van Emburgh Ave | ~17,900 | $501,000 (Oct 2022) | $1,375,000 (Jan 2024) | 2023 | ~3,500 finished | 2.7x |
| 326 Northern Pkwy | 16,350 (75x218) | $535,000 (Nov 2022) | $1,860,000 (Apr 2026) | 2024 | 3,218 plus 400 garage | 3.5x |
| 473 Cambridge Rd | ~14,400 | $558,000 (Oct 2022) | $2,798,000 (Jul 2025) | 2023 | 3,813 | 5.0x |
| 219 Brookside Ave | 6,882 | $649,000 (Apr 2023) | $1,650,000 (Apr 2025) | 2025 | 2,500 | 2.5x |
| 383 Stevens Ave | 17,990 | $725,000 (Jan 2023) | $1,800,000 (May 2024) | 2023 | 3,843 | 2.5x |
| 20 N Pleasant Ave | 14,000 | prior sale not shown | $2,600,000 (Feb 2026) | 2025 | 3,896 | n/a |
Two more transactions look like lot acquisitions whose new houses have not yet resold: 725 Midwood Rd (6,926 sf lot, 1,305 sf cape sold “strictly as-is” for $615,000 in September 2024; assessor now shows year built 2025) and 414 Jefferson St (9,365 sf lot, sold $640,000 in August 2025; assessor shows year built 2026).144 Both are sub-10,500 sf lots, which means both replacement houses were sized under the 34% or 35% tier of Table 11.2 or went to the Board.
What the six pairs say, with the caveat that six is six: entry prices for a Ridgewood lot with an obsolete house ran $500,000 to $725,000 in 2022 and 2023 and $615,000 to $640,000 in 2024 and 2025 for lots under 10,000 sf; finished houses of 2,500 to 3,900 sf resold at $1.4 million to $2.8 million, the two 2026 closings at $1.86 million and $2.60 million. Spreads of $1.0 million to $2.2 million before construction, carry and commission are what keep builders bidding on as-is capes. No builder is named in any listing retrieved; identities are†.
The tax column connects to Section 2. 473 Cambridge Rd moved to a $1,186,500 assessment and a $34,290 bill, up 152.6%; 383 Stevens Ave to $1,199,700 and $34,671, up 243.5%.145 A new house is assessed at completion, not at the 2027 revaluation, and the tax line on a new-construction listing is often the demolished house’s number.
What I tell my buyers: if you are buying a small lot to add on, the number to get from the architect before the offer is the existing gross building area and the existing footprint, measured the way §190-3 measures them, against Tables 11.2 and 11.1. On a 9,375 sf lot, the difference between 1,500 sf and 1,875 sf of footprint is the difference between a permit and a hearing.
Accessory dwelling units
Ridgewood’s code has no definition of an accessory dwelling unit and no provision permitting one; the only zone in which a second dwelling unit on a lot is a permitted use is R-3, and only as a two-family structure.146147 Finishing a basement or a garage as a separate unit in R-1 or R-2 is a use variance (d(1)). The adopted Fourth Round Housing Element and Fair Share Plan (June 23, 2025) does not use accessory units as a compliance mechanism.148 At the state level,†.
The 2026 affordable housing overlays
The Village’s fourth-round obligation is 427 units of prospective need for 2025 through 2035, with zero rehabilitation need.149 The plan meets it through downtown B-1/B-2 rezoning (313 units anticipated across 78 acres), a C-R-1 district on Chestnut Street (25 units), the Kensington assisted-living site on North Maple (about 12 affordable beds), a townhouse overlay at 299 Goffle Road (4 units), and the existing Two Forty Associates project (7 units built).150 Ordinances 4071 through 4075, adopted February 11, 2026, wrote the S-1 Senior Overlay, TO-1 Townhouse Overlay and C-R-1 districts into Chapter 190.151 None of them touches the single-family bulk table. They do change what can be built on the edges of the R-3 and R-4 zones near the central business district, and an owner two blocks from Chestnut Street or the Franklin Avenue corridor should read them before assuming the block will look the same in 2029.
† Figures marked with a dagger are best-effort research, so verify them with the issuing office (the Village of Ridgewood, the school district, the county, the state or the utility) before making judgment calls or decisions on them.
12. Inspection Issues by Build Era
Ridgewood’s housing stock was built across more than a century, and the inspection findings that matter most track the decade of construction more closely than they track price. What follows is a field guide organized by era, followed by the Village- and State-level requirements that apply at closing regardless of era.
Table 12.1. Ridgewood single-family and residential sales by decade of construction, deeds recorded 1/2021 to 8/2026. Analysis by Ashish Desai Group from Bergen County deed records; as of September 7, 2026.
| Decade built | Sales | Share |
|---|---|---|
| Before 1900 | 70 | 4.0% |
| 1900s | 105 | 6.1% |
| 1910s | 126 | 7.3% |
| 1920s | 306 | 17.7% |
| 1930s | 214 | 12.4% |
| 1940s | 164 | 9.5% |
| 1950s | 411 | 23.8% |
| 1960s | 110 | 6.4% |
| 1970s | 50 | 2.9% |
| 1980s | 46 | 2.7% |
| 1990s | 20 | 1.2% |
| 2000s | 25 | 1.4% |
| 2010s | 23 | 1.3% |
| 2020s | 60 | 3.5% |
Median year built of a house that sold, 1940. Sixty-one percent of what traded was built before 1950; 84 percent before 1960. This is a sales-weighted view; the Census (ACS 2020 to 2024, table B25034) puts the median year built for all Ridgewood housing units at 1950 with 74 percent built before 1960, which Section 15 reports. The 2020s row includes new construction on teardown lots and the multifamily buildings described in Section 10.
Table 12.2. Price and assessment by era, same sales.
| Era built | n | Median sale price | Median price per sq ft (n) | Median assessment as % of sale price, 2025 to 2026 sales (n) |
|---|---|---|---|---|
| Before 1900 | 70 | $1,345,000 | $464 (70) | 55.2% (19) |
| 1900 to 1919 | 231 | $1,200,000 | $477 (231) | 50.4% (85) |
| 1920 to 1939 | 520 | $1,105,000 | $488 (520) | 50.1% (191) |
| 1940 to 1959 | 575 | $900,000 | $486 (575) | 50.7% (195) |
| 1960 to 1979 | 160 | $972,500 | $434 (160) | 53.6% (55) |
| 1980 to 1999 | 66 | $984,500 | $414 (66) | 51.8% (26) |
| 2000 to 2009 | 25 | $1,790,000 | $479 (25) | 55.0% (8) |
| 2010 and later | 83 | $1,050,000 | $473 (80) | 54.7% (35) |
Price per square foot uses the assessor’s building square footage. The 2010-and-later row mixes new single-family construction with condominium and apartment resales, which pulls its median down. The last column is the Section 2 calculation done on every 2025 to 2026 sale in the deed record: the assessment on the current roll divided by what the buyer paid. Every era sits near 50 percent, against a certified 2026 Village ratio of 60.52 percent, which is the revaluation exposure of a recent buyer expressed one decade at a time.
Pre-1900 and 1900–1919 (Victorian, foursquare, early colonial)
The oldest homes cluster near the downtown, the train station, and the Heights. The recurring findings:
- Balloon framing. Wall studs run continuously from sill to roof with no fire-stopping between floors. Not a defect in itself, but it changes the fire-spread picture and the cost of any renovation that opens walls.
- Knob-and-tube wiring. Ungrounded, often buried in later blown-in insulation, and frequently spliced into modern circuits. Insurers increasingly require replacement or a licensed electrician’s letter before binding.
- Slate and tile roofs. Long-lived when maintained, but repair labor is specialized and flashing, not the slate, is the usual failure point.
- Stone and rubble foundations. Mortar deterioration, moisture intrusion, and the absence of a footing drain are the standard notes. Finished basements in these houses deserve a second look.
- Lead-based paint. Federal law (the Residential Lead-Based Paint Hazard Reduction Act, implemented by EPA and HUD) requires the seller of any pre-1978 dwelling to disclose known lead paint, provide the EPA pamphlet, and give the buyer a 10-day window to inspect unless waived in writing.152
1920s–1930s (Tudor, center-hall colonial, Dutch colonial)
This is the largest share of Ridgewood’s pre-war stock and the era with the most expensive hidden systems.
- Buried heating oil tanks. Homes of this period were almost universally oil-heated, and the tank was often buried. A converted house with gas heat does not mean the tank was removed; see the UST discussion below.
- Galvanized steel supply piping. Internal corrosion reduces flow and eventually leaks. Partial replacement (copper spliced onto galvanized) is common and creates dissimilar-metal corrosion at the joint.
- Cast iron drain lines. Rated life of 75 to 100 years, which this era has now reached. A sewer camera inspection is a $300 to $500 line item that routinely finds five-figure problems.
- Asbestos pipe wrap and boiler insulation. EPA lists pipe and furnace insulation, vinyl floor tile backing, roofing and siding shingles, and textured coatings among the products in older homes that may contain asbestos.153 Intact material is generally managed in place; disturbing it triggers licensed abatement.
- Original wood windows. Single-glazed, often with lead paint on the sash. Restoration versus replacement is a cost and historic-character question that the Village’s historic district rules can affect.
1940s–1950s (capes, ranches, split-levels)
Post-war construction filled in the west and north of the Village.
- Asbestos-cement siding and 9-inch floor tile. Both are common in this era and both are non-friable when left alone. Removal is regulated; encapsulation is usually the practical answer.
- Undersized electrical service. 60-amp services and fuse panels remain in unrenovated homes. Modern loads (EV charging, heat pumps, induction ranges) push most buyers toward a 200-amp upgrade.
- Oil-to-gas conversions with abandoned tanks. Many conversions in the 1980s and 1990s left the tank in the ground, sometimes filled with sand, sometimes empty. New Jersey permits abandonment in place, but the Village’s own guidance notes that “more and more we find that lenders and insurance companies want tanks removed,” and that a tank filled in place is harder to remove later.154
1960s–1970s
- Aluminum branch-circuit wiring, 1965 to roughly 1973. The U.S. Consumer Product Safety Commission reports that homes built before 1972 and wired with aluminum are “55 times more likely” to have connections reach fire-hazard conditions than copper-wired homes, and recommends full replacement, COPALUM crimp pigtails, or AlumiConn connectors rather than twist-on connectors.155
- Federal Pacific Electric “Stab-Lok” and Zinsco panels. Neither is the subject of a current federal recall, but both are widely flagged by inspectors for breaker-trip failure and are routinely required to be replaced by insurers. Budget $2,500 to $4,500 for a panel swap.
- Polybutylene supply piping (mid-1970s to mid-1990s). Grey plastic pipe that fails at fittings; the subject of a national class-action settlement. Less common in Ridgewood than in Sun Belt markets but present in some 1980s additions and renovations.
1980s–2000s
Fewer systemic issues. The recurring items are original roofs, HVAC and water heaters at end of life, deck ledger attachment on 1990s decks, and radon (this era’s tighter envelopes hold more of it). Renovations from these decades are where unpermitted work most often turns up.
2010s and later (new construction and teardowns)
- Stucco and EIFS moisture. Synthetic stucco (EIFS) installed without proper drainage planes and flashing traps water in the sheathing. Damage is invisible from outside. A moisture probe survey by an EIFS-certified inspector is the relevant test, and it is invasive.
- Warranty transfer. Builder warranties under the New Jersey New Home Warranty Act (administered by NJ DCA) run 1, 2 and 10 years on workmanship, systems and structure respectively; confirm enrollment and whether the warranty transfers.
What I tell my buyers: the inspection that finds the tank, the sewer line, and the panel is rarely the general home inspection. Those are three separate specialists (tank sweep, sewer camera, electrician) and together they cost under $1,000. In a market where inspection contingencies are being waived, a pre-offer tank sweep and sewer scope are the two I push hardest to keep.
What Ridgewood requires at resale
No Certificate of Continued Occupancy. The Village Building Department states that it “does not issue a CO for the resale of a one or two family dwelling.”156 What is required is the State-mandated Certificate of Smoke Alarm, Carbon Monoxide Alarm and Portable Fire Extinguisher Compliance under N.J.A.C. 5:70-2.3, which must be obtained “before any one- and two-family or attached single family structure is sold, leased, or otherwise made subject to a change of occupancy.”157 Ridgewood codified its own version in Chapter 149, Article II of the Village Code (Ordinance 2000, adopted August 27, 1985), which requires the seller to obtain the certificate from the Village and directs the inspection to occur “within 10 business days of the receipt of said application.”158 The issuing office is the Ridgewood Bureau of Fire Prevention (201-444-7898).159
The State fee schedule at N.J.A.C. 5:70-2.9(d) is $45 if the application is filed more than 10 business days before the change of occupancy, $90 at 4 to 10 business days, and $161 at fewer than 4.160†
Open permits. The Village does not publish an open-permit search as part of the resale process.†
Ridgewood Water final read. The seller is responsible for scheduling a final meter reading, which “should be scheduled 3-5 days before the closing,” by form (emailed to cswater@ridgewoodnj.net) or by phone at 201-670-5520.161 No fee is listed.
Underground heating oil tanks
Removal or abandonment requires a construction permit from the Ridgewood Building Department. The Village’s process: the tank is drained of oil and sludge, inspected for holes, and either removed or filled with inert material, with fill neck, vent and fuel lines removed and disposal documentation submitted.162†
If the tank has leaked, State rules under N.J.A.C. 7:1E-5.3 require the responsible party to “immediately notify the Department at (877) WARN DEP.”163 Residential heating oil discharges are handled through NJDEP’s Unregulated Heating Oil Tank (UHOT) program, and the case appears on the Known Contaminated Sites List until a No Further Action letter issues. One Ridgewood address (553 N. Maple Ave) currently carries an “Active - UHOT” status on that list.164
State grant money is not realistically available. NJDEP’s Petroleum UST Remediation, Upgrade and Closure Fund states that it “is accepting new applications for unregulated petroleum underground storage tanks, which include home heating oil tanks,” but that “these applications will not be reviewed or processed at this time due to insufficient funds,” with an estimated wait of “3.5 years from the date of receipt of the application.”165† Buyers should assume a leaking tank is an out-of-pocket cost. Simple removals run $1,500 to $3,000; remediation of a leaking tank commonly runs $10,000 to $50,000 and occasionally more.
Radon
NJDEP assigns Ridgewood to Tier 2 (moderate radon potential). In the Department’s 2015 Radon Tier Assignment Report, 5,412 Ridgewood homes had been tested, 277 (5%) at or above the EPA action level of 4 pCi/L; Bergen County overall was 11,131 of 120,836 (9.2%).166 Tier 2 means 5 to 24 percent of tested homes exceed 4 pCi/L.†
New Jersey does not require radon testing at sale. N.J.S.A. 26:2D-73 makes test results confidential to the property owner but requires a seller who has tested to provide the buyer with the results and any evidence of mitigation at the time the contract is executed, and gives a buyer who arranges testing the right to those results.167
Known Contaminated Sites in the Village
NJDEP’s Known Contaminated Site List (data load date July 3, 2026) shows 31 sites within the Village of Ridgewood.168 Twenty are under Licensed Site Remediation Professional oversight (“Active”), eight are “Active - Post Rem” (remediation complete, restricted use under a Remedial Action Permit or pending one), and three are publicly funded groundwater cases at Ridgewood Water wells. None is on the federal NPL.
| Site | Address | Program | Status | CEA |
|---|---|---|---|---|
| Ridgewood Village DPW Central Garage | 220 Chestnut St | LSRP | Active | Lifted |
| Richters Service Station | 209 S Maple Ave | LSRP | Active | Ongoing |
| The Corner Garage | 24 Franklin Ave | LSRP | Active | Ongoing |
| Bergen Convenience Flagship | 490 Rte 17 S | LSRP | Active | Ongoing |
| 7-Eleven #44773 | 465-475 Goffle Rd | LSRP | Active | Ongoing |
| Ridgewood Cleaners | 168 E Ridgewood Ave | LSRP | Active | — |
| Town Garage (former) | 120 Franklin Ave | LSRP | Active | Ongoing |
| Triangle Tiger Service Station | 10 Godwin Ave | LSRP | Active | Lifted |
| NJDOT Ridgewood Maintenance Yard | 547 Rt 17 | LSRP | Active | Ongoing |
| Lucerne Co | 175-197 E Ridgewood Ave | LSRP | Active | Ongoing |
| Schedler Property | 460 W Saddle River Rd | LSRP | Active | — |
| Budget Rent A Car | 103 Franklin Ave | LSRP | Active | Ongoing |
| 132 Franklin Avenue | 132 Franklin Ave | LSRP | Active | — |
| Former NJMVC Inspection Station | 150-174 Chestnut St | LSRP | Active | Ongoing |
| 46 Chestnut Street | 46 Chestnut St | LSRP | Active | Ongoing |
| Community Gardens | 268 Meadowbrook Ave | LSRP | Active | — |
| Hudson Street Lots | 25-31 Hudson St | LSRP | Active | — |
| 615 Franklin Turnpike | 615 Franklin Tpke | LSRP | Active | — |
| J.H. Ferguson & Sons | 607 Franklin Tpke | LSRP | Active - Post Rem | Ongoing |
| 51 N Walnut St | 51 N Walnut St | RAP | Active - Post Rem | Ongoing |
| Ridgewood Shell | 657 Franklin Tpke | RAP | Active - Post Rem | Ongoing |
| Hawes Elementary School | 531 Stevens Ave | RAP | Active - Post Rem | — |
| Sunoco 0006-6993 | 500 Rte 17 | RAP | Active - Post Rem | Ongoing |
| Brogan Cadillac | 100 S Broad St | RAP | Active - Post Rem | Ongoing |
| 51-53 South Broad Street | 51-53 S Broad St | RAP | Active - Post Rem | — |
| Ridgewood Ash Landfill | Demarest St | RAP | Active - Post Rem | — |
| Ridgewood Coal Gas (PSE&G) | Ackerman Ave & Bellair Rd | RAP | Active - Post Rem | — |
| 553 North Maple Avenue | 553 N Maple Ave | UHOT | Active - UHOT | — |
| Ridgewood Water, Grove Street Well | Grove St | Pub. funded | Active | — |
| Ridgewood Water, West End Ave Well | West End Ave | Pub. funded | Active | — |
| Ridgewood Water, Walthery & Twinney | Walthery Ave & Red Birch St | Pub. funded | Active | — |
“CEA” is a Classification Exception Area, a groundwater zone in which standards are suspended while contamination is addressed; “Ongoing” means a CEA is in place. Site coordinates in the NJDEP dataset are approximate. The list changes daily; re-query before publication.
Practical reading: the sites are gas stations, garages, a dry cleaner, the former manufactured-gas plant, and municipal properties, concentrated along Franklin Avenue, Route 17, and the downtown. A residential parcel adjacent to a CEA site can carry a groundwater use restriction that affects irrigation wells and geothermal installations; it does not affect Village water service. The Schedler Property (460 West Saddle River Road), a Village-owned park site, was added June 11, 2024 and remains in active remediation.
Flood
Maps. Ridgewood is NFIP community 340067. The governing FEMA Flood Insurance Study for Bergen County (34003CV001B through 006B) and the Flood Insurance Rate Map panels covering the Village (34003C0069J, 0088J, 0157J, 0159J, 0176H, 0177H, 0178H) are effective August 28, 2019, and are adopted by reference in Chapter 154 of the Village Code (Ordinance 3865, July 14, 2021).169170†
The corridors. Two watercourses run through the Village: the Saddle River along the eastern side (Paramus Road, the Duck Pond, East Saddle River Road, Grove Street area) and the Ho-Ho-Kus Brook along the western side (Maple Avenue, Godwin Avenue, Lincoln Avenue, the DPW and Graydon area, Vesta Court, Kenilworth Road, and the Maxwell Place and James Street reaches near the confluence). The Special Flood Hazard Area (Zone AE) follows both channels and widens near the confluence south of downtown. Street-level SFHA status is parcel-specific and must be read from the FIRM or an elevation certificate.†
Ida. The USGS gauge on the Saddle River at Ridgewood (01390500, at Route 17) recorded its highest discharge in 55 years of record on September 2, 2021: 7,390 cfs at a 12.01-foot stage, exceeding Irene (6,770 cfs, August 28, 2011) and Floyd (5,380 cfs, September 16, 1999).171 FEMA declared a major disaster (DR-4614) on September 5, 2021 with Bergen County designated for Individual Assistance.172 NFIP claims data for ZIP 07450 show 50 claims with dates of loss on September 1–2, 2021, totaling $1,457,903 in building and contents payments; 44 of the 50 were on policies rated in Zone AE and 6 in Zone X.173 For comparison, Irene produced 130 claims in the same ZIP. All-time NFIP claims for 07450 number 415 (through the June 1, 2026 data freeze).174† The Village held a Community Rating System Class 7 (15% premium discount in the SFHA) as of 2012.175†
New rules that change what can be built. NJDEP’s Inland Flood Protection Rule, adopted July 2023, sets the required elevation of habitable first floors “two feet higher than currently indicated on DEP state flood maps and three feet higher than indicated on FEMA maps,” based on a climate-adjusted flood elevation reflecting projected precipitation increases of 23 to 50 percent by 2100. It applies to new and substantially reconstructed development in riverine flood hazard areas, not to existing homes.176 The Village’s Chapter 154 separately requires one foot of freeboard or the N.J.A.C. 7:13 standard, whichever governs.177 For a buyer, the consequence is that a teardown or a renovation exceeding the substantial-improvement threshold on a Saddle River or Ho-Ho-Kus Brook lot must be built to the higher elevation, which affects both cost and what the finished house looks like.
Disclosure. Since March 20, 2024 (P.L. 2023, c. 93), every New Jersey seller must answer flood-risk questions on the property condition disclosure statement: whether any part of the property is in the FEMA Special Flood Hazard Area (100-year) or Moderate Risk (500-year) area; whether flood insurance is federally mandated; whether the seller has received federal flood disaster assistance; current flood insurance coverage; whether an elevation certificate exists; whether flood claims have been filed; and whether the property has experienced flood damage, water seepage or pooled water from a natural event.178 NJDEP provides a Flood Risk Notification lookup tool for this purpose. The law applies to all sellers, including those selling “as is.”
Lead service lines
Ridgewood Water (PWSID NJ0251001) serves Ridgewood, Glen Rock, Midland Park and Wyckoff. Its July 7, 2023 inventory submission to NJDEP reported 20,326 service lines: 1,708 lead, 1,286 galvanized requiring replacement, 1,607 unknown, and 17,011 non-lead, with a replacement target of 171 lines per year.179 The New Jersey Infrastructure Bank describes the system as having “more than 3,000 service lines that are wholly or partially lead” and closed a $17.9 million Water Bank loan on February 26, 2026 for full replacement.180 Contract 1 (2025–2026) covers approximately 500 addresses under $3.25 million of Water Bank financing;181 the Village separately reported $1,535,000 in federal funding in February 2026 and crews completing three to four replacements per day in Ridgewood.182 State law (P.L. 2021, c.183) requires all lead and galvanized lines replaced by July 2031.183
The private side (curb stop to house) is the owner’s cost. Ridgewood Water’s program offers either payment in full within 14 days of invoice or 30-year financing through a special assessment on the property; the utility’s own example is a $5,000 job financed to roughly $8,000 over 30 years.184 A buyer should check the address in Ridgewood Water’s Service Line Look-up Tool before offering, and ask whether an assessment is already recorded against the property.†
† Figures marked with a dagger are best-effort research, so verify them with the issuing office (the Village of Ridgewood, the school district, the county, the state or the utility) before making judgment calls or decisions on them.
13. Commute
As of September 7, 2026. Timetables, fares and permit fees in this section change on fixed cycles (NJ Transit fares each July 1; Village parking permits each calendar year; rail timetables several times a year). Every figure carries its effective date.
The short version
Ridgewood is a Hoboken-terminal town. Every train from Ridgewood station goes to Hoboken Terminal. There is no train from Ridgewood to New York Penn Station, and there has never been one. A Manhattan-bound rail commuter either changes at Secaucus Junction to a Northeast Corridor train for Penn Station, or rides to Hoboken and takes PATH or a ferry. Midtown Direct, the one-seat service that Morris & Essex and Montclair-Boonton towns advertise, does not serve the Main Line or the Bergen County Line.12
That is the structural fact about the Ridgewood commute, and it is the one that consumer real estate sites usually blur into “about an hour to Midtown.” The honest description is a two-seat ride to Penn Station and a two-seat ride (rail plus PATH) to Lower Manhattan or 33rd Street, with a one-seat ride only to Hoboken.
Two lines, one station
Ridgewood sits where NJ Transit’s Main Line and Bergen County Line come back together. The two lines split at Secaucus and run different routes through southern Bergen County before rejoining just south of Ridgewood, at Ridgewood Junction north of Glen Rock.2 The practical consequences for a Ridgewood rider:
- Both lines stop at Ridgewood. Ridgewood riders can take whichever train comes next; the two lines serve different intermediate stations but the same endpoints (Hoboken; Suffern or Waldwick outbound).
- Bergen County Line trains stop at Glen Rock-Boro Hall, Radburn, Broadway (Fair Lawn), Plauderville, Garfield, Wesmont and Rutherford before Secaucus.2
- Main Line trains stop at Glen Rock-Main Line, Hawthorne, Paterson, Clifton, Passaic, Delawanna, Lyndhurst and Kingsland before Secaucus.3
- Some peak-period trains terminate or originate at Ridgewood rather than continuing to Waldwick or Suffern. Historically this has meant a few extra peak departures for Ridgewood that towns north of it do not get.2
Ridgewood station itself was rebuilt for ADA compliance between February 2009 and September 2011 and has high-level platforms on three tracks.1 The ticket office at 6 Garber Square is open 5:00 AM to 12:30 PM weekdays (closed 10:20 to 10:50 AM), closed weekends; two ticket vending machines sit outside the building.4 Ho-Ho-Kus, the next station north, is not ADA-accessible; Glen Rock-Main Line, the next station south on the Main Line, has low-level platforms and is not ADA-compliant.56 For anyone with a stroller, a bicycle or a mobility limitation, Ridgewood is the accessible station in this stretch of the line.
Ridership. Ridgewood averaged 1,228 weekday boardings in 2025, ranked 26th of 153 NJ Transit stations. Ho-Ho-Kus averaged 308 (84th). Glen Rock’s two stations combined averaged 602 in 2024; Radburn 799 in 2024.1567 The Main and Bergen County lines together carried about 17,300 weekday riders in the first quarter of fiscal 2025.3
Service levels: what the schedule says
The figures below are from NJ Transit’s own schedule service for a regular weekday (Wednesday, September 10, 2026) and the following Saturday and Sunday, under the timetable effective August 30, 2026.8
| Measure | Value |
|---|---|
| Weekday trains from Ridgewood toward Hoboken, all day | 52 |
| Weekday inbound departures from Ridgewood, 6:00 to 8:59 AM | 14 (plus 4 between 5:13 and 5:49 AM) |
| Weekday outbound departures from Hoboken, 4:00 to 6:59 PM | 15 |
| Ridgewood to Hoboken, typical | 46 to 51 minutes |
| Ridgewood to Hoboken, fastest peak trains | 39 minutes (7:01 and 7:35 AM); 34 minutes at 3:20 PM |
| Ridgewood to New York Penn Station via Secaucus, typical | 53 to 65 minutes, including a 5 to 15 minute transfer |
| Ridgewood to New York Penn Station, fastest peak trains | 47 to 48 minutes (7:01 and 7:35 AM) |
| First weekday inbound train from Ridgewood | 5:13 AM |
| Last weekday outbound train from Hoboken | 1:32 AM (from New York Penn, 1:22 AM) |
| Weekend service | 37 trains Saturday, 35 Sunday: two trains about eight minutes apart at the top of each hour, from 6:32 AM to about 10:40 PM, plus one after midnight |
What that means in practice. In the morning peak a train leaves Ridgewood roughly every 12 minutes, and the ride to Hoboken is 45 to 50 minutes on most of them; two trains, the 7:01 and the 7:35, run a shorter stopping pattern and make it in 39. For Penn Station, add the walk between the two levels at Secaucus and the wait for the next Northeast Corridor train: the schedule’s connecting times show that adding 5 to 15 minutes, for a door-to-door of about 55 minutes to an hour on most peak trains and 47 to 48 minutes on the two fast ones. Coming home, fifteen trains leave Hoboken between 4 and 7 PM, about one every 11 minutes.
Off-peak, the pattern is two trains an hour, a Main Line and a Bergen County Line train a few minutes apart, then a gap of 45 to 50 minutes. Weekends are the same two-trains-an-hour pattern all day. A commuter who misses a train off-peak or on a weekend is waiting most of an hour, which is the single biggest difference between Ridgewood’s service and a Midtown Direct town’s.
Direct Penn Station service: verified negative. No train on the Main Line or Bergen County Line operates to New York Penn Station. The Wikipedia line summaries and NJ Transit’s station page both list Hoboken as the sole eastern terminus.123 The physical reason is that these lines reach Secaucus on the upper level, which has no track connection to the Northeast Corridor on the lower level. The Gateway program’s proposed “Bergen Loop” (also called the Secaucus Loop) would build that connection and give Main, Bergen and Pascack Valley riders a one-seat ride to Penn Station. It is a second-phase Gateway element with a construction window described as 2024 to 2030; it is not funded to completion, not under construction as of this writing, and should not be priced into a Ridgewood purchase.11
What changed in 2025 and 2026
- Portal North Bridge opened March 13, 2026, three days early, replacing the 115-year-old swing bridge on the Northeast Corridor between Newark and Secaucus. A one-track cutover ran February 15 to March 15, 2026 with reduced service.12 This affects Ridgewood riders only on the Secaucus-to-Penn leg; the Hoboken-bound leg does not cross Portal Bridge. The benefit is fewer bridge-related delays on that final segment, not a faster scheduled time.
- Hoboken Terminal. The PATH station at Hoboken closed for most of February 2025 for track and platform replacement, and again for five days August 28 to September 2, 2025 for emergency interlocking repairs. NJ Transit awarded a $211 million contract in March 2024 to rebuild six tracks and three platforms at the terminal, with construction under way since May 2024. The rebuilt bus terminal reopened December 8, 2025.13 Track work at Hoboken has produced and will continue to produce weekend and off-peak schedule adjustments on all Hoboken Division lines.
- Schedule revisions. NJ Transit issued Main/Bergen timetable changes effective November 10, 2024 (“minor time changes”), March 15, 2026, May 31, 2026 and August 30, 2026.8914 Four revisions in 22 months is normal for this line; the point for a buyer is that any specific train time quoted during a house search will probably not survive to closing.
Fares
Ridgewood is in NJ Transit rail fare zone 9.1 Rail fares are set by origin and destination, so the Hoboken fare and the New York Penn Station fare differ, and a New York ticket is valid for the Secaucus transfer.
Fare history matters here because it is now on autopilot. NJ Transit raised fares 15% systemwide on July 1, 2024 (its first increase since 2015), then 3% on July 1, 2025, and 3% again on July 1, 2026. The 2024 board action built in automatic 3% increases every July 1 without further hearings; the July 1, 2027 increase is already scheduled.1516 One-way tickets expire 30 days after purchase; monthly passes go on sale at 5 PM on the 19th of the prior month.17
| Ridgewood (zone 9), effective July 1, 2026 | One-way | Monthly |
|---|---|---|
| To Hoboken | $10.95 | $300.00 (weekly $93.00; ten-trip $104.50) |
| To New York Penn Station (via Secaucus) | $11.80 | $362.00 (weekly $109.50; ten-trip $118.00) |
Fares are as returned by NJ Transit’s schedule service on September 9, 2026, and match the Adjusted Fares effective July 1, 2026.18 Apply 3 percent for the July 1, 2027 figure: about $309 and $373 a month.
NJ Transit’s published systemwide range after the 2026 increase is $1.80 to $23.85 for a one-way rail ticket.18 A monthly rail pass is also valid on NJ Transit buses and light rail for the number of zones printed on it.18 For a five-day commuter the New York monthly works out to about $8.60 a round trip against $23.60 on one-way tickets; the Hoboken monthly, about $7.15 against $21.90.
Station parking: the expensive part
This is where Ridgewood diverges from its neighbors, and it belongs in carrying-cost math.
The Village of Ridgewood, not NJ Transit, owns and prices every commuter lot. The station lot at Garber Square (Lot 1) has 105 standard spaces plus 5 accessible spaces.4 The Hudson Street garage, four levels and 240 spaces, was financed with a $12 million bond ordinance in July 2018 and opened November 6, 2020.1920 Debt service on that garage is one of the reasons the permit prices below look the way they do.
Permit structure (Village of Ridgewood, 2026 program).212223
| Permit | Where it works | 2024 fee (Village) | 2026 fee (secondary source) |
|---|---|---|---|
| Ridgewood Resident Sticker | Base sticker; required before buying a daily pass; free | $0 | $0 |
| Premium Permit, resident | Train station lot before 9 AM; Hudson Street garage level 2 all day; Cottage Place; Route 17 Park and Ride | $1,425 | $1,500 (Village 2026 application: “Resident Premium - Annual $1,500 per calendar year”) |
| Premium Permit, non-resident | Same | $1,500 | $1,800† |
| Non-Premium Permit, resident | Hudson Street garage level 3; Cottage Place; Route 17 Park and Ride | $1,075 | $1,150† |
| Non-Premium Permit, non-resident | Same | $1,125 | † |
| Daily pass (resident, with sticker) | Train station lot, Hudson garage level 3, Cottage Place | not captured | $18/day† |
| Hourly, station lot | $0.50/hr per NJ Transit page; see contradiction note | ||
| Hourly, Hudson Street garage | $1.25/hr Mon–Sat, free Sundays and federal holidays | ||
| CBD Employee sticker | Garage level 4, Cottage, Walnut lots | $30/yr | $30/yr; hangtag $110/mo |
| Overnight permit (CBD residents) | Hudson garage level 2, Prospect, Cottage, Wilsey Square lots, 8 PM–8 AM | $75/3 mo, $150/6 mo | not captured |
The 2024 column is from the Village’s own archived parking page. The 2026 resident Premium figure of $1,500 is confirmed from the Village’s 2026 Ridgewood Parking Permit Application (DocumentCenter View 418, posted December 18, 2025). The remaining 2026 figures come from a January 31, 2026 local blog post and are flagged; the same Village PDF lists them and should be read in full. The Village parking page (retrieved September 7, 2026) confirms: kiosks and meters $1.25 per hour, Monday to Friday 9 am to 8 pm and Saturday 10 am to 6 pm, Sunday and federal holidays free; the train station lot is three-hour kiosk parking after 9 am only, and before 9 am requires a Premium Permit or a Resident Sticker with a daily pass; Hudson Street garage level 2 all day with a Premium Permit, level 3 all day with either permit or a daily pass, level 4 for CBD employees; Cottage Place lot all day; permits are obtained at the Village Hall reception desk.212223†
How permits are sold. In person only, at the Village Hall reception desk, 131 North Maple Avenue, Monday through Friday 8:30 AM to 4:30 PM, with a driver’s license and current vehicle registration for each car. Sales for the following year open in mid-December (December 17 in 2024; late December in 2025). Daily passes for the station lot, garage level 3 and Cottage Place are sold online through the Village site to holders of the free resident sticker.212224
Capacity and the waitlist. The Village has capped premium permits in the past (210 in the 2018 program) and has run a lottery for the small number of on-street commuter spaces on Ridge Road South.2526 Whether a waitlist exists for 2026 premium permits, and how long it is, is not published.†22
Rules that surprise new owners. Non-residents may not park in the station lot 6 AM to 6 PM Monday through Saturday. No parking in the station lot 1 AM to 5 AM. Permit requirements in the off-street lots lift at noon on weekdays, when three-hour public parking opens on every level of the garage.42026 The Village ended the non-resident annual placard program on December 31, 2023 by ordinance, though non-resident premium and non-premium permits still appear on the current fee list; which non-resident products remain for sale is a question for the same phone call.26
What neighbors charge. The same January 2026 blog post that reports Ridgewood’s $1,500 lists Allendale at $75 (resident) and $300 (non-resident), Glen Rock at $240, Ho-Ho-Kus at $275 and the Route 17 Park and Ride at about $975.23 Glen Rock-Main Line has 190 spaces.6 These are secondary figures and should be confirmed with each borough, but the order of magnitude is the point: a Ridgewood commuter who parks at the station pays five to twenty times what the next town over charges, every year, and that gap is a recurring cost of the address in the same way the tax bill is.
Bus
Ridgewood Bus Terminal is a shelter with benches at Oak and Dayton Streets at Van Neste Square, about 820 feet from the train station.27 Three NJ Transit routes matter for a Manhattan commute:
- Route 163 to Port Authority Bus Terminal via Garden State Plaza and Route 4; terminates at Ridgewood.2728
- Route 164 to Port Authority Bus Terminal; a variant of the 163 that continues north to Midland Park and serves the Ridgewood Route 17 Park and Ride.228
- Route 175 to the George Washington Bridge Bus Station (A train at 175th Street, A and 1 at 181st) via Route 4, Hackensack and Paramus; terminates at Ridgewood.2729
Route 148 does not serve Ridgewood. It is a weekday rush-hour route from Midland Park that runs to Manhattan by a different alignment.28 Listings that mention “the 148” for Ridgewood are describing a route that does not stop in the Village.†
Driving
Ridgewood has no direct highway. Route 17 runs along the eastern edge of the Village; Route 4 is reached via Route 17 south. The George Washington Bridge is reached by Route 4 east; the Lincoln Tunnel by Route 17 south to Route 3.†
Bridge and tunnel tolls are set by the Port Authority of New York and New Jersey and change on a separate schedule from NJ Transit fares.
Park-and-ride alternatives
| Alternative | What it is | Note |
|---|---|---|
| Ridgewood Route 17 Park and Ride | Village-owned lot on Route 17; NJ Transit 163/164 to PABT | Village permit product; blog-reported at about $975 in 2026†23 |
| Glen Rock-Main Line | Main Line station, 190 spaces, borough-run pay lot | Low-level platforms, not ADA-compliant6 |
| Glen Rock-Boro Hall | Bergen County Line station, borough lot with ticket machine | Zone 87 |
| Ho-Ho-Kus | Both lines, zone 10 | Not ADA-accessible; blog-reported $275 permit523 |
| Radburn (Fair Lawn) | Bergen County Line, zone 6 | 799 weekday riders (2024)30 |
| Paramus Park | NJ Transit route 168 to PABT | Not a 163/164/175 stop28 |
The zone numbers are worth a second look. Glen Rock is zone 8 and Radburn is zone 6; a household that drives five minutes south to board pays a lower monthly fare and, on current secondary figures, a fraction of the parking cost. Whether that trade is worth it depends on the household, but it is a real trade, and it is one that Ridgewood’s own pricing creates.
What I tell my buyers: the number to add to the monthly carrying cost is not the train fare. It is the train fare plus $125 a month for a premium permit, if you can get one, and the answer to “can I get one” is a phone call the Village will not put on its website. Make that call before the inspection, not after.
† Figures marked with a dagger are best-effort research, so verify them with the issuing office (the Village of Ridgewood, the school district, the county, the state or the utility) before making judgment calls or decisions on them.
14. Neighborhood Profiles
The problem with neighborhood names
Ridgewood has no official neighborhood map. The Village’s zoning ordinance, Master Plan and tax maps do not adopt neighborhood boundaries, and the names in common use (Upper Ridgewood, the Heights, the Lawns, Willard, Somerville, Travell) are a mix of historic subdivision names and elementary school attendance areas. Listing sites print them as if they were fixed attributes of an address. They are not, and a report that promises verifiable figures cannot build tables on them.
What can be verified is the Census tract. Ridgewood is covered by exactly five 2020 census tracts (471 through 475), which nest inside the Village boundary with no spillover; their 2020 populations sum to the Village count of 25,979.185 Every deed record in the county file carries a tract code. This section therefore profiles the Village by tract, names the streets that fall in each so the reader can locate them, and joins two independent primary sources: the Census (population, tenure, owner-reported value, median year built) and the Bergen County deed record for January 2021 through August 2026 (what actually sold, for how much, on what lot, built when).186187
The tract is a statistical unit, not a market. Where a tract straddles two very different housing types, the tables say so.
The five tracts at a glance
Table 14.1. Census profile by tract. ACS 2020 to 2024 five-year estimates unless noted; as of September 7, 2026.188
| Tract | 2020 population | Occupied units | Owner share | Renter households | Owner-reported median value | Median year built |
|---|---|---|---|---|---|---|
| 471 | 6,135 | 2,093 | 94.6% | 114 | $848,000 (±$33,927) | 1954 |
| 472 | 4,481 | 1,614 | 90.6% | 151 | $998,800 (±$124,052) | 1943 |
| 473 | 3,287 | 997 | 96.9% | 31 | $1,285,200 (±$125,773) | 1939 or earlier |
| 474 | 5,158 | 2,132 | 50.6% | 1,053 | $663,400 (±$167,483) | 1953 |
| 475 | 6,918 | 2,067 | 90.0% | 207 | $840,200 (±$80,393) | 1949 |
| Village | 25,979 | 8,903 | 82.5% | 1,556 | $891,200 (±$27,689) | 1950 |
Table 14.2. Deed record by tract, residential sales at $100,000 and above with a usable sale code, January 2021 through August 2026. Analysis by Ashish Desai Group from Bergen County deed records (NJ Property Records export). As of September 7, 2026.189
| Tract | Sales | Median sale price, 2021 to 2026 | Median price per sq ft | Median year built (of what sold) | Built before 1930 | Median lot (acres) | Share in R-1, R-110, R-125 or R-1A | 2025 to 2026 sales (n) | Median price, 2025 to 2026 | Assessment as % of price, 2025 to 2026 |
|---|---|---|---|---|---|---|---|---|---|---|
| 471 | 321 | $855,000 | $434 | 1950 | 19% | 0.24 | 32% | 83 | $931,000 | 50.9% |
| 472 | 234 | $1,195,000 | $452 | 1940 | 27% | 0.28 | 69% | 39 | $1,380,000 | 49.7% |
| 473 | 209 | $1,560,000 | $444 | 1930 | 45% | 0.42 | 92% | 49 | $2,000,000 | 54.6% |
| 474 | 197 | $895,560 | $426 | 1920 | 63% | 0.23 | 14% | 49 | $994,600 | 51.4% |
| 475 | 336 | $870,000 | $455 | 1948 | 33% | 0.21 | 15% | 62 | $1,004,999 | 51.6% |
Price per square foot uses the assessor’s building area. “Assessment as % of price” is the current-roll assessment divided by the 2025 to 2026 sale price, the Section 2 calculation; the certified 2026 Village ratio is 60.52%. Tract 474 includes the downtown condominium and apartment stock, which lowers its medians; see the tract note.
The two tables agree with each other and disagree with the listing-site version of Ridgewood in one important way. Owner-reported values (Census) run 25 to 40 percent below what buyers paid in 2025 and 2026 in every tract. The gap is smallest in tract 473 and largest in tracts 471 and 475. That gap is the revaluation exposure described in Section 2, and it is not evenly distributed.
Tract 473: west of the tracks, north of West Ridgewood Avenue
Streets in the deed record: Highland Avenue, Knollwood Road, Mountain Avenue, Orchard Place (upper), West Ridgewood Avenue, Westend Avenue, Melrose Place, North Monroe Street (upper), Gardner Road, North Murray Avenue, Monte Vista Avenue, Lincoln Avenue, Beechwood Road, Heights Road.190 This is the area listings call Upper Ridgewood and the Heights.
Smallest tract by population (3,287), highest owner share (96.9%), oldest stock (median year built 1939 or earlier per Census; 1930 in the deed record, with 45 percent of sales built before 1930). Ninety-two percent of sales are in the large-lot zones (R-1, R-110, R-125), and the median lot is 0.42 acres, double the Village figure. Median sale 2021 to 2026: $1,560,000; 2025 to 2026: $2,000,000. This is where the $2.5 million-and-above segment described in Sections 3 and 5 mostly lives, and its slower days-on-market figures apply here more than anywhere else.
Assessment against price runs 54.6 percent, the closest to the 60.52 ratio of the five tracts. Homes here have drifted least; the revaluation should move this tract’s share less than the others’.
Tract 472: west side, Hillcrest and the Heights slope
Streets in the deed record: Hillcrest Road, Upper Boulevard, North Monroe Street, Alpine Terrace, Summit Street, Hamilton Road, Morningside Road, Glenwood Road, Beveridge Road, Sherwood Road, Heights Road, Shelbourne Terrace, Phelps Road, Fairmount Road.191 Willard School (601 Morningside Road) sits in this tract.
Population 4,481; owner share 90.6%. Sixty-nine percent of sales are in R-1 or larger zones; median lot 0.28 acres. Median year built 1943 (Census) and 1940 (sales). Median sale 2021 to 2026: $1,195,000; 2025 to 2026: $1,380,000. The 2025 to 2026 median puts this tract in the $1.2 million to $1.8 million band, which Section 3 shows selling at 112.6 percent of asking with competition 86 percent of the time.
Assessment against price: 49.7 percent, the lowest of the five. Buyers here since 2025 are, on the median, assessed at half of what they paid. Section 2’s arithmetic falls hardest on this tract.
Tract 472 also contains the largest cluster of repeat sales at 1.8x or more (Section 11): Hillcrest, Beveridge, Shelbourne, Sherwood and Glenwood all appear in that list. The 1950s and 1960s houses on these streets are the teardown inventory.
Tract 471: north and east, Glen Avenue to the Ho-Ho-Kus line
Streets in the deed record: East Glen Avenue, North Pleasant Avenue, Walthery Avenue (north), Northern Parkway, Fairfield Avenue, Bogert Avenue, Barnett Place, Eastbrook Road, Van Emburgh Avenue, Steilen Avenue, Cambridge Road, Roslyn Road, Van Buren Street, North Maple Avenue (north).192 Travell School (340 Bogert Avenue), Graydon Pool and the Village Hall complex are in or at the edge of this tract; the Ho-Ho-Kus Brook corridor and the Saddle River corridor (Section 12) both touch it.
Largest tract by sales volume (321) and second largest by population (6,135). Owner share 94.6%. Two-thirds of sales are R-2; 55 percent of what sold was built in 1950 or later, the highest post-war share in the Village. Median lot 0.24 acres. Median sale 2021 to 2026: $855,000; 2025 to 2026: $931,000. This is the core of the $800,000 to $1.2 million band, the most competitive product in the Village by Section 3’s measure (111.1 percent of asking, 85 percent sold above ask).
Assessment against price: 50.9 percent. The Census median year built (1954) and the post-war share identify this as the cape-and-split-level tract; Section 12’s 1940s to 1950s inspection list (asbestos siding, 60-amp service, oil-to-gas conversions with a tank left in the ground) applies here first.
Tract 475: east and south, Ridgewood Avenue to the Paramus and Glen Rock lines
Streets in the deed record: East Ridgewood Avenue, Pershing Avenue, Berkshire Road, Spring Avenue, Brookside Avenue, Linwood Avenue, Stevens Avenue, South Irving Street, Grove Street, Kenilworth Road, Walthery Avenue (south), Laurel Road, Alanon Road, South Pleasant Avenue.193 Hawes School (531 Stevens Avenue), Somerville School (45 South Pleasant Avenue) and the Duck Pond (Saddle River County Park) are in this tract; the Saddle River runs its eastern edge, and the Kenilworth Road and Grove Street reaches are in the corridor Section 12 describes.
Largest tract by population (6,918) and by owner households (1,860). Owner share 90.0%. Seventy-seven percent of sales are R-2; median lot 0.21 acres, the smallest of the five owner tracts. Fifteen R-4 (garden apartment) sales are in this tract’s record. Median sale 2021 to 2026: $870,000; 2025 to 2026: $1,004,999. Price per square foot, $455, is the highest of the five tracts: smaller houses on smaller lots, priced at a premium per foot.
Assessment against price: 51.6 percent. Pershing Avenue, Berkshire Road, Brookside Avenue and Stevens Avenue account for nine of the 56 repeat sales at 1.8x or more in Section 11; this is the second teardown cluster.
Tract 474: downtown and the south-central blocks
Streets in the deed record: Doremus Avenue, Oak Street, South Maple Avenue, Woodside Avenue, Orchard Place (lower), Prospect Street, Garfield Place, Union Street, Hope Street, Lenox Avenue, Bellair Road, Spencer Place, Ethelbert Place, Washington Place.194 Orchard School (230 Demarest Street), George Washington Middle School (155 Washington Place), the Central Business District, the train station, the four multifamily buildings described in Section 10 and the Chestnut Street C-R-1 district are all here.
This tract is two markets in one statistical unit. It holds 1,053 of the Village’s 1,556 renter households (68 percent), which is why its owner share is 50.6 percent against 90 percent or better everywhere else, and why its Census median value ($663,400, with a wide ±$167,483 margin) is the lowest. The single-family streets, by contrast, are the oldest in the Village: 63 percent of what sold was built before 1930, and the median year built of a sale is 1920. Thirty-seven percent of sales are in R-3, the only zone that permits a two-family house, and Section 11’s 50 by 100 R-3 arithmetic (1,750 square feet of gross building area, all floors) is the binding constraint on this tract’s lots.
Median sale 2021 to 2026: $895,560; 2025 to 2026: $994,600. Assessment against price: 51.4 percent. Absentee-owner purchases, where the deed record carries the flag, are 9 of 101 here against 3 to 14 of 115 to 157 elsewhere; the difference is small and the flag is incomplete, so it is reported and not interpreted.
The forward-looking item for this tract is Section 10. The February 2026 ordinances put 20 units per acre across the B-1 and B-2 districts, 24 on the west side of South Broad Street outside the historic district, and 30 on Chestnut Street. Every one of those parcels is in tract 474, and the residential streets that abut them (Marshall Street, Franklin Avenue, the lower ends of Oak and Union) are the ones whose surroundings can change inside a three-year holding period.
Elementary school assignment
The district assigns elementary and middle schools by street address; the street-to-school directory is held by the Registrar at the Education Center, 49 Cottage Place, .195 Section 7 shows why the assignment should be treated as an assignment and not a guarantee: enrollment has fallen 16.7 percent at Travell and 10.3 percent at Benjamin Franklin over three years while Orchard and Somerville grew, which is the pattern that precedes a boundary review.196†
What the analyst still owes this section
Three things would turn these profiles from tract statistics into neighborhood profiles. First, a boundary map: the Census Bureau’s 2020 tract reference sheet for Bergen County gives the bounding streets, and a one-page map with the five tracts, the six elementary schools, the station and the two flood corridors belongs at the head of this section.197 Second, the NJMLS close-to-list and days-on-market figures by tract, which require geocoding the closed-sales file against the TIGER address-range file; the deed record does not carry list price. Third, PropStream owner-tenure and estimated-equity fields by tract, which the deed record approximates (Section 15 reports that 50.8 percent of Village owners have been in place since before 2010) but does not replace.†
What I tell my buyers: the name on the listing tells you which school the seller thinks you get and roughly where the house is. The tract tells you what the neighbors paid, how old the houses are, and how far the assessments have drifted. On the west side above Ridgewood Avenue, a 2025 buyer is assessed at half of what they paid. That is the number to put next to the school name.
† Figures marked with a dagger are best-effort research, so verify them with the issuing office (the Village of Ridgewood, the school district, the county, the state or the utility) before making judgment calls or decisions on them.
15. Demographics, Ownership and Equity
Method and a warning about the data
Everything in this section comes from the U.S. Census Bureau: the 2000, 2010 and 2020 Decennial Censuses and the American Community Survey (ACS) 2020–2024 5-year estimates, with the 2015–2019 and 2019–2023 vintages used where a before-and-after comparison is the point. Geography is Ridgewood village (place FIPS 34-63000), compared to Bergen County (34-003) and New Jersey (34).
Two cautions. First, the ACS is a sample survey. For a place of 26,000 people the margins of error on housing subgroups run 5 to 15 percent, and they are printed below. Second, the ACS “value” of a home is what the owner thinks it is worth, averaged over five years. It is not a sale price and it lags the market. The gap between the ACS figure and what Section 3 reports from closed sales is discussed under “Contradictions” at the end of this file, because it is large.
Population
| Year | Ridgewood | Change | Source |
|---|---|---|---|
| 2000 | 24,936 | Census 2000 SF1, P001 [1] | |
| 2010 | 24,958 | +0.1% | Census 2010 SF1, P1 [2] |
| 2020 | 25,979 | +4.1% | Census 2020 DHC, P1 [3] |
| 2020–2024 ACS | 26,308 ±33 | ACS B01003 [4] |
Ridgewood’s population was flat for a decade and then grew about 4 percent between 2010 and 2020. Bergen County’s ACS population is 962,316; New Jersey’s is 9,343,809 [4].
Households
| Ridgewood | Bergen County | New Jersey | |
|---|---|---|---|
| Households | 8,903 ±400 | 355,127 | 3,507,701 |
| Family households | 7,072 (79.4%) | ||
| Married-couple households | 5,902 (66.3%) | ||
| Householder living alone | 1,422 (16.0%) | ||
| Households with one or more people under 18 | 3,886 (43.6%) | 114,074 (32.1%) | 1,093,692 (31.2%) |
| Average household size | 2.93 | 2.68 | 2.62 |
| Average household size, owner-occupied | 3.00 | 2.86 | 2.75 |
| Average household size, renter-occupied | 2.59 | 2.34 | 2.38 |
| Median age | 41.6 | 42.0 | 40.1 |
Ridgewood households are larger than the county’s and the state’s, and 43.6 percent of them include a child under 18, against 32.1 percent countywide. Median age is in line with the county.
Age distribution (Ridgewood, ACS B01001, n = 26,308)
| Age | Persons | Share |
|---|---|---|
| Under 5 | 1,289 | 4.9% |
| 5 to 17 | 5,960 | 22.7% |
| 18 to 24 | 2,102 | 8.0% |
| 25 to 34 | 1,864 | 7.1% |
| 35 to 44 | 3,084 | 11.7% |
| 45 to 54 | 4,942 | 18.8% |
| 55 to 64 | 3,402 | 12.9% |
| 65 to 74 | 1,851 | 7.0% |
| 75 and over | 1,814 | 6.9% |
| Under 18 | 7,249 | 27.6% |
| 65 and over | 3,665 | 13.9% |
Source: ACS B01001 [9]. Individual five-year bands carry margins of ±100 to ±400 persons.
The 25-to-34 band is 7.1 percent of residents. The 45-to-54 band is 18.8 percent. Ridgewood has more than twice as many residents in their late forties and early fifties as in their late twenties and early thirties.
Income
| Ridgewood | Bergen County | New Jersey | |
|---|---|---|---|
| Median household income | $208,211 ±17,735 | $124,884 ±1,735 | $103,556 ±513 |
Source: ACS B19013 [10]. Table S1901 reports the same median with the income distribution. Ridgewood’s median household income is 1.67 times the county’s and 2.01 times the state’s. Note the ±$17,735 margin: the true Ridgewood median lies somewhere between about $190,000 and $226,000.
Home values as owners report them
| Ridgewood | Bergen County | New Jersey | |
|---|---|---|---|
| Median value, owner-occupied units, 2020–2024 | $891,200 ±27,689 | $623,000 ±4,306 | $454,400 ±1,150 |
| Median value, 2019–2023 | $882,700 ±27,148 |
Source: ACS B25077, 2024 and 2023 vintages [11][12].
Distribution of owner-reported value (ACS B25075) [13]
| Value band | Units | Share |
|---|---|---|
| Under $500,000 | 651 | 8.9% |
| $500,000 to $749,999 | 1,683 ±328 | 22.9% |
| $750,000 to $999,999 | 2,372 ±452 | 32.3% |
| $1,000,000 to $1,499,999 | 1,731 ±265 | 23.6% |
| $1,500,000 to $1,999,999 | 471 ±113 | 6.4% |
| $2,000,000 or more | 439 ±141 | 6.0% |
| $1,000,000 or more | 2,641 | 35.9% |
The 651 units under $500,000 include 107 reported under $10,000 and 81 between $40,000 and $50,000. Those are almost certainly response errors or non-standard units, and the sub-$500,000 band should be read as roughly 8 to 9 percent, not parsed further.
Section 3 of this report puts the 2026 year-to-date median sale price at $1,460,088. The ACS median of $891,200 is a five-year average of self-reported estimates ending in 2024, and owners who have not transacted recently anchor on older prices. The two numbers measure different things and the gap between them is itself information: a large share of Ridgewood owners are carrying a mental value of their home that is materially below what a buyer would pay today. That matters for the revaluation discussion in Section 2, because the assessor will use sales, not owner opinion.
Tenure
| Ridgewood | Bergen County | New Jersey | |
|---|---|---|---|
| Occupied housing units | 8,903 ±400 | 355,127 | 3,507,701 |
| Owner-occupied | 7,347 ±495 (82.5%) | 232,025 (65.3%) | 2,239,128 (63.8%) |
| Renter-occupied | 1,556 ±245 (17.5%) | 123,102 (34.7%) | 1,268,573 (36.2%) |
Source: ACS B25003 [14]. Ridgewood’s owner-occupancy rate is 17 points above the county’s.
Housing stock: what kind of buildings
Units in structure (ACS B25024, all housing units) [15]
| Structure type | Ridgewood | Share | Bergen County | New Jersey |
|---|---|---|---|---|
| 1-unit, detached | 7,257 ±389 | 79.0% | 53.1% | 52.6% |
| 1-unit, attached | 218 | 2.4% | 5.8% | 10.0% |
| 2 units | 445 | 4.8% | 12.6% | 8.6% |
| 3 or 4 units | 216 | 2.4% | 5.6% | 6.1% |
| 5 to 19 units | 334 | 3.6% | 7.0% | 9.5% |
| 20 or more units | 691 | 7.5% | 15.4% | 12.3% |
| Mobile home, boat, RV, van | 30 | 0.3% | 0.5% | 1.0% |
| Total units | 9,191 ±391 | 369,613 | 3,791,354 |
Four of every five Ridgewood housing units are detached single-family houses. Buildings of five or more units are 11.2 percent of the stock, half the county share of 22.4 percent. This is the structural reason the Village’s affordable-housing obligations (Section 11) translate into multifamily proposals that stand out: there is little existing multifamily to absorb them.
Year structure built (ACS B25034) [16]
| Built | Ridgewood units | Share | Bergen County | New Jersey |
|---|---|---|---|---|
| 2020 or later | 206 ±100 | 2.2% | 1.4% | 1.1% |
| 2010 to 2019 | 227 ±112 | 2.5% | 5.3% | 6.2% |
| 2000 to 2009 | 80 ±52 | 0.9% | 6.0% | 9.2% |
| 1990 to 1999 | 126 ±74 | 1.4% | 5.3% | 8.9% |
| 1980 to 1989 | 353 ±146 | 3.8% | 8.2% | 11.8% |
| 1970 to 1979 | 372 ±161 | 4.0% | 9.4% | 12.3% |
| 1960 to 1969 | 989 ±239 | 10.8% | 13.7% | 12.8% |
| 1950 to 1959 | 2,197 ±313 | 23.9% | 20.8% | 13.8% |
| 1940 to 1949 | 1,160 ±396 | 12.6% | 10.6% | 6.5% |
| 1939 or earlier | 3,481 ±276 | 37.9% | 19.3% | 17.4% |
| Median year built | 1950 ±4 | 1960 | 1970 |
Three-quarters of Ridgewood’s housing (74.4 percent) predates 1960, against 50.7 percent countywide and 37.7 percent statewide. More than a third predates 1940. Only 4.7 percent was built in the last fifteen years. The practical consequences (lead paint disclosure on pre-1978 housing, underground oil tanks, knob-and-tube and cloth wiring, cast-iron drains, asbestos, undersized electrical service) belong in Section 12 and are the norm here rather than the exception. The median Ridgewood house is 76 years old.
Vacancy
Of 9,191 housing units, 288 ±160 were vacant (3.1 percent): 98 for rent, 36 for sale, 88 sold but not yet occupied, 20 seasonal or occasional use, 46 “other vacant.” The rental vacancy rate computes to 5.9 percent (98 of 1,654) and the homeowner vacancy rate to 0.5 percent (36 of 7,383), but the margins on these counts are as large as the counts themselves and they should be read as “very low” and nothing more precise. Source: ACS B25002, B25004 [18][19].
Mortgage status: the public equity proxy
The Census does not measure equity. The closest public proxy is whether an owner has any mortgage at all.
| Ridgewood | Share of owners | Bergen County | New Jersey | |
|---|---|---|---|---|
| Owner-occupied units | 7,347 ±495 | 232,025 | 2,239,128 | |
| With a mortgage, contract to purchase, or similar debt | 5,090 ±471 | 69.3% | 61.6% | 63.9% |
| Of which: also carrying a second mortgage or home equity loan | 614 ±157 | 8.4% | 7.4% | 7.0% |
| Owned free and clear (no mortgage) | 2,257 ±329 | 30.7% | 38.4% | 36.1% |
Source: ACS B25081 [20]. Category labels for the second-mortgage/home-equity subrows changed in the 2024 table layout; the with-mortgage and no-mortgage totals are unaffected.†
Ridgewood has a lower free-and-clear share than the county or the state, despite older housing and higher incomes. Two things push that way: the price of entry means recent buyers carry large mortgages, and the 1990s–2010s cohort (described below) is still inside a 30-year amortization. It does not mean Ridgewood owners have less equity. A 2015 buyer at $850,000 with a $680,000 mortgage is sitting on roughly $1 million of equity at 2026 prices while still counting as “with a mortgage” here.
†
How long owners have been in place
Year householder moved into unit (ACS B25038) [21]
| Moved in | Ridgewood owners | Share | Bergen owners | NJ owners | Ridgewood renters |
|---|---|---|---|---|---|
| 2021 or later | 98 ±61 | 1.3% | 1.6% | 1.7% | 58 (3.7%) |
| 2018 to 2020 | 665 ±153 | 9.1% | 10.8% | 12.1% | 546 (35.1%) |
| 2010 to 2017 | 2,850 ±509 | 38.8% | 31.3% | 32.7% | 647 (41.6%) |
| 2000 to 2009 | 1,618 ±210 | 22.0% | 21.8% | 22.3% | 206 (13.2%) |
| 1990 to 1999 | 1,152 ±244 | 15.7% | 15.9% | 14.9% | 80 (5.1%) |
| 1989 or earlier | 964 ±172 | 13.1% | 18.7% | 16.2% | 19 (1.2%) |
| Owners in place since before 2010 | 3,734 | 50.8% | 56.3% | 53.4% | |
| Owner-occupied total | 7,347 | 232,025 | 2,239,128 | 1,556 |
Half of Ridgewood’s owners have been in their house for more than fifteen years. The largest single cohort, 38.8 percent, arrived between 2010 and 2017, buying at prices that Section 3 shows were roughly 40 to 60 percent below today’s. Only 1.3 percent of owners moved in during 2021 or later, which is consistent with the collapse in sales volume reported in Section 3 (sales fell from 355 in 2021 to about 227 a year in 2024–2025). These figures cover 2020–2024 survey responses and understate 2025–2026 arrivals.
†
What I tell my buyers: the seller across the table from you has, more often than not, owned the house since Obama’s first term, has a mortgage balance that is a fraction of your offer, and is not under pressure to accept anything. That is why Section 4’s percentages look the way they do. Ridgewood sellers can wait. Price your offer for a seller who does not need you.
Monthly owner costs and cost burden
| Ridgewood | Bergen County | New Jersey | |
|---|---|---|---|
| Median selected monthly owner costs, with a mortgage | $4,000+ (top-coded) | $3,547 ±32 | $2,829 ±8 |
| Median selected monthly owner costs, without a mortgage | $1,500+ (top-coded) | $1,498 ±18 | $1,232 ±6 |
Source: ACS B25088 [22]. The Census top-codes these medians at $4,000 and $1,500. Ridgewood exceeds both caps, so the true medians cannot be read from ACS. The “without a mortgage” figure is mostly property tax, insurance and utilities; Section 6 gives the actual median tax bill.
Owner cost burden, monthly owner costs as a share of household income (ACS B25091) [23]
| Ridgewood | Bergen County | New Jersey | |
|---|---|---|---|
| Owners with a mortgage, costs 30% or more of income | 1,629 of 5,064 (32.2%) | 34.7% | 32.3% |
| Owners with a mortgage, costs 50% or more of income | 583 of 5,064 (11.5%) | 14.6% | 13.2% |
| Owners without a mortgage, costs 30% or more of income | 513 of 2,243 (22.9%) | 24.1% | 22.0% |
| Owners without a mortgage, costs 50% or more of income | 313 of 2,243 (14.0%) | 11.2% | 10.6% |
Denominators exclude households for which the ratio could not be computed (26 with a mortgage, 14 without). Ridgewood’s burden rates for mortgaged owners are close to the county’s. The one figure that stands apart is the share of unmortgaged owners paying half or more of income in housing costs: 14.0 percent, against 11.2 percent countywide. With no mortgage in the picture, that is property tax against a fixed or retirement income. Section 2’s revaluation will land on that group first.
Education, labor force and how people get to work
Educational attainment, population 25 and over (ACS B15003) [24]
| Ridgewood | Bergen County | New Jersey | |
|---|---|---|---|
| Bachelor’s degree or higher | 13,576 (80.1%) | 53.1% | 43.6% |
| Graduate or professional degree | 6,337 (37.4%) | 21.5% | 17.6% |
| High school graduate or GED only | 1,319 (7.8%) | 20.0% | 25.3% |
| Less than high school | 255 (1.5%) | 7.1% | 9.3% |
Labor force (ACS B23025) [25]: population 16 and over 20,127; in labor force 13,597 (67.6 percent); employed 13,131; unemployed 463 (3.4 percent of the civilian labor force, ±1.1 points).
Means of transportation to work, workers 16 and over (ACS B08301) [26][27]
| Mode | Ridgewood 2015–2019 | Ridgewood 2020–2024 | Bergen 2020–2024 | NJ 2020–2024 |
|---|---|---|---|---|
| Workers 16 and over | 11,082 ±408 | 12,834 ±578 | 487,054 | 4,582,367 |
| Drove alone | 6,421 (57.9%) | 6,016 (46.9%) | 59.0% | 62.2% |
| Carpooled | 590 (5.3%) | 623 (4.9%) | 7.3% | 7.7% |
| Public transportation, all | 2,410 (21.7%) | 1,545 (12.0%) | 10.4% | 8.1% |
| of which bus | 871 (7.9%) | 726 (5.7%) | 7.5% | 4.0% |
| of which commuter rail | 1,408 (12.7%) | 758 (5.9%) | 1.8% | 1.7% |
| Walked | 305 (2.8%) | 296 (2.3%) | 2.5% | 2.6% |
| Worked from home | 1,228 (11.1%) | 4,116 (32.1%) | 18.5% | 16.8% |
Mean travel time: 301,810 aggregate minutes (ACS B08013) over 8,718 workers who did not work from home computes to 34.6 minutes [28].†
This is the largest change in any table in this section. Between the 2015–2019 and 2020–2024 survey windows, the share of Ridgewood workers working from home nearly tripled, from 11.1 to 32.1 percent, and the count of commuter-rail riders fell by almost half, from 1,408 to 758. Ridgewood’s work-from-home share is now 13.6 points above the county’s. Its rail-commuter share, at 5.9 percent, is still more than three times the county’s 1.8 percent, so the station remains a distinguishing feature of the Village, but the 2020–2024 figure describes a town where roughly one worker in three does not commute at all. Section 13 covers NJ Transit service levels; the ridership side of that story is here.
Census tracts
Ridgewood is covered by five 2020 census tracts. Tract-level figures below feed Section 14 and are reproduced there with joins.
| Tract | 2020 population | Occupied units | Owner share | Median value | Median household income | Median year built |
|---|---|---|---|---|---|---|
| 471 | 6,135 | 2,093 | 94.6% | $848,000 ±33,927 | $202,625 ±36,515 | 1954 |
| 472 | 4,481 | 1,614 | 90.6% | $998,800 ±124,052 | $208,700 ±59,564 | 1943 |
| 473 | 3,287 | 997 | 96.9% | $1,285,200 ±125,773 | $250,000+ (top-coded) | 1939 or earlier |
| 474 | 5,158 | 2,132 | 50.6% | $663,400 ±167,483 | $160,278 ±47,485 | 1953 |
| 475 | 6,918 | 2,067 | 90.0% | $840,200 ±80,393 | $224,556 ±38,166 | 1949 |
| Village | 25,979 | 8,903 | 82.5% | $891,200 | $208,211 | 1950 |
† Figures marked with a dagger are best-effort research, so verify them with the issuing office (the Village of Ridgewood, the school district, the county, the state or the utility) before making judgment calls or decisions on them.
16. Cost of Living Beyond the Mortgage
Principal, interest and property tax are the lines every buyer models. This section covers what sits underneath them in Ridgewood: a Village-owned water utility in the middle of a nine-figure treatment program, a sewer charge that never appears as a bill, a garbage service with no fee, a permit schedule that matters the moment you renovate a 1930s house, and two energy rate changes from the state’s capacity auction. Every figure is cited to the issuing agency or flagged.
Ridgewood Water
Ridgewood Water is a department of the Village of Ridgewood, not a private utility. It serves four municipalities: Ridgewood, Glen Rock, Midland Park and Wyckoff, from 53 deep wells plus purchased water from the Passaic Valley Water Commission, the Borough of Hawthorne and Veolia.198 It serves roughly 61,700 customers.199 Bills are quarterly.200
Rate structure. Three components, all set by Village ordinance (most recently Ord. 4085, adopted March 11, 2026):201
- A fixed quarterly facility fee by meter size.
- A fixed quarterly PFAS surcharge by meter size, added in 2024.
- A volume charge per 1,000 gallons (which includes a $0.01 state tax). There are no consumption tiers.
Ridgewood Water residential rates, 2024 through 2026 (as of September 7, 2026)202
| Component | 2024 H1 | 2024 H2 | 2025 H1 | 2025 H2 | 2026 H1 | 2026 H2 |
|---|---|---|---|---|---|---|
| Volume, per 1,000 gal | $5.70 | $5.87 | $5.87 | $6.40 | $6.40 | $6.90 |
| Facility fee, 5/8” meter (qtr) | $32.98 | $32.98 | $32.98 | $35.95 | $35.95 | $38.83 |
| Facility fee, 3/4” meter (qtr) | $49.97 | $49.97 | $49.97 | $53.93 | $53.93 | $58.25 |
| Facility fee, 1” meter (qtr) | $82.44 | $82.44 | $82.44 | $89.88 | $89.88 | $97.08 |
| PFAS surcharge, 5/8” (qtr) | $14.12 | $24.71 | $24.71 | $37.07 | $37.07 | $40.78 |
| PFAS surcharge, 3/4” (qtr) | $21.18 | $37.07 | $37.07 | $55.61 | $55.61 | $61.17 |
| PFAS surcharge, 1” (qtr) | $35.30 | $61.78 | $61.78 | $92.68 | $92.68 | $101.95 |
H1 = January through June billing; H2 = July through December. Rates for 2022 and 2023 (Ord. 3945, adopted April 12, 2023) are not on the current rate page and are flagged below.
Rate increases, computed from the table above. Volume rate: +3.0% (mid-2024), +9.0% (mid-2025), +7.8% (mid-2026); cumulative +21.1% from early 2024 to late 2026. Facility fee, 5/8” meter: +9.0% (2025), +8.0% (2026); cumulative +17.7%. PFAS surcharge, 5/8” meter: +75% (mid-2024), +50% (2025), +10% (2026); cumulative +189%. Every increase has taken effect with the third-quarter bill.
What a household of four pays. Ridgewood Water does not publish a typical-household figure. The table below assumes 25,000 gallons per quarter (about 275 gallons per day, which is on the high side of a four-person indoor load and includes some summer irrigation). Adjust up or down; the fixed charges do not change with use.
Modeled quarterly and annual water bill at 2026 H2 rates, 25,000 gal/quarter (computed)
| Meter | Facility fee | PFAS surcharge | Volume (25 × $6.90) | Quarter | Year |
|---|---|---|---|---|---|
| 5/8” | $38.83 | $40.78 | $172.50 | $252.11 | $1,008 |
| 3/4” | $58.25 | $61.17 | $172.50 | $291.92 | $1,168 |
| 1” | $97.08 | $101.95 | $172.50 | $371.53 | $1,486 |
At 20,000 gallons per quarter the 5/8” bill is $217.61; at 30,000 it is $286.61. The same 5/8” household at 25,000 gallons paid $189.60 per quarter at 2024 H1 rates. That is a 33.0% increase in the total bill in thirty months, of which the PFAS surcharge accounts for $26.66 of the $62.51 rise. The PFAS surcharge is now 16% of the quarterly bill.
The PFAS program. In 2020 New Jersey adopted maximum contaminant levels of 14 parts per trillion for PFOA and 13 ppt for PFOS. Ridgewood Water has been out of compliance since. Its April 2023 public notice reported PFOA above the MCL at 23 treatment plants (running annual averages 17 to 31 ppt) and PFOS above the MCL at 4 plants (14 to 17 ppt).203 The utility entered an Administrative Consent Order with NJDEP in May 2023.204 The remedy is to consolidate 31 treatment points into 12 granular-activated-carbon treatment facilities.205
The compliance picture, from the utility’s own quarterly notices:206207
| Notice date | PFOA exceedances (points of entry) | PFOA RAA range | PFOS exceedances | Facilities online |
|---|---|---|---|---|
| Apr 8, 2025 | 22 | 18–35 ppt | 4 | 2 |
| Jul 22, 2025 | 22 | 18–35 ppt | 4 | 2 |
| Oct 22, 2025 | 22 | 18–36 ppt | 4 | 3 |
| Jul 16, 2026 | 18 | 14–36 ppt | 4 | 7 |
As of July 16, 2026: seven of the twelve facilities are online, four more are “on track to be completed by the end of 2026,” and the last (Cedar Hill, Wyckoff) is expected in the first quarter of 2027.208 The 2026 Water Quality Report states 11 of 12 will be online by year-end 2026.209 No boil-water notice was in effect as of the retrieval date, and the 2024 and 2025 quality reports show no violations for lead, copper, nitrate or disinfectants.210211 The PFOA and PFOS MCL violations remain open.
Cost and funding. The Village has not published a single total. The utility’s director has described it as roughly a $100 million project; news accounts citing the utility put it at $98 million to $117 million, with the largest facility (Cedar Hill) at $12.2 million.212213 Documented pieces: bond ordinances of $42 million and $18.5 million adopted February 8, 2023, and a further $11 million bond ordinance in late 2024 (both from news accounts; the ordinances themselves are on the Village site, which blocked retrieval);214215 three New Jersey Infrastructure Bank loans totaling $18,547,052 closed January 26, 2026;216 a $2.8 million EPA grant and a $1 million state grant.217
The settlement. The Village authorized execution of a settlement response in its litigation against 3M and DuPont on December 6, 2023; the terms were discussed in closed session and the public minutes do not state a dollar amount.218 Separately, the federal court approved the national water-provider class settlements with 3M and DuPont in 2024–2025, and the State of New Jersey’s own settlements (up to $450 million from 3M and approximately $2.5 billion combined) were approved in 2026.219†
Expected rate impact going forward. The PFAS surcharge has risen every year since it was created and the last four facilities plus Cedar Hill are still being built and financed.† The direction is not in doubt. Debt service on roughly $80 million of PFAS bonds and loans, less whatever settlement proceeds offset it, is a cost that will be in the facility fee and surcharge for decades.
Lead service lines. This is the item most buyers of a 1930s house do not know about. Ridgewood Water reports approximately 1,200 known customer-side lead service lines remaining plus 250 lines of unknown material, after 500 replacements in Phase 1 (2025–2026); 175 owners have signed up for Phase 2, which goes to bid this summer.220221 State law requires all lead and galvanized lines replaced by 2031.222 The utility replaces the public side; the owner pays for the curb-to-house segment. Owners who opt in to the Village contractor can pay the invoice within 14 days or finance over 30 years as a special assessment on the property tax bill. The utility’s own example: a $5,000 replacement financed over 30 years costs about $8,000, or $267 per year, and the assessment stays with the property and transfers to the buyer.223 Ask for the service-line material in due diligence; the utility publishes a lookup tool.224
Sewer
Ridgewood operates its own Water Pollution Control Facility. For residential users, there is no sewer bill: Village Code §238-59A puts residential and small non-residential users (one equivalent dwelling unit or less) on ad valorem taxation, meaning sewer is inside the tax rate.225 Only large dischargers and tax-exempt users pay a per-1,000-gallon charge.226 A portion of the Village is instead tributary to the Northwest Bergen County Utilities Authority, which lists “portions of Ridgewood” among its eleven member areas.227†
Solid waste
Garbage is a Village service with no separate fee. Collection is twice weekly from the rear or side yard (containers within 20 feet of the house, 32 gallons and 80 pounds maximum): Monday and Thursday west of Maple Avenue, Tuesday and Friday east of it.228229 Bulk items are collected curbside on alternating Wednesdays, seven items maximum, nothing over 100 pounds, no building materials.230231 An unscheduled pickup costs $150 (up to 6 cubic yards) or $250 (over 6).232 Curbside recycling runs on an area calendar (eight areas); the Village also operates a recycling center at Lakeview.233† Yard waste must be containerized (paper bags or cans); grass clippings may not be mixed with leaves or brush; loose leaves may be placed at the curb only during the dates on the annual leaf collection schedule, at least 10 feet from a storm drain, with fines up to $2,000 per violation.234†
Permit fees for common projects
The Village fee schedule is Chapter 145 of the Code, last amended for construction in December 2024 (Ord. 4026) and for land-use and soil permits on July 15, 2026 (Ord. 4102).235236 From the Code:
| Item | Fee | Source |
|---|---|---|
| New building or addition, building subcode | $0.065 per cubic foot; minimum $250 | Code §145-6 (Ch. 125)237 |
| State DCA training surcharge (all NJ) | $0.00371/cu ft new; $1.90 per $1,000 alterations | N.J.A.C. 5:23-4.19238 |
| Engineering review, single-family, impervious area increase over 200 sq ft | $300 (was $150) | Ord. 4102, eff. Aug 4, 2026239 |
| Soil removal permit: ministerial / minor / major | $50 / $150 / $200, plus $0.25 per cu yd | Ord. 4102240 |
| Sidewalk permit | $25 | Code §145-4241 |
| Swimming pool license, year-round / seasonal | $275 / $200 | Code §145-5242 |
| Tree removal, private property, any tree 8” DBH or larger | Permit required; one replacement tree per tree removed (home improvement) | Ch. 260, Ord. 4043 (Apr 9, 2025)243 |
| Adopt-a-Tree / memorial tree | $1,000 / $1,500 (were $450 / $650) | Ord. 4103, eff. Aug 4, 2026244 |
Two things are verifiable regardless. First, any project that adds more than 200 square feet of impervious surface (a patio, a driveway widening, an addition) now triggers a $300 engineering review on top of the building permit, doubled this summer.245 Second, removing any tree of 8 inches diameter or more on your own lot requires a permit and a replacement tree, under an ordinance rewritten in April 2025.246
Graydon Pool
Graydon is the Village’s sand-bottom swimming pond. The 2026 season ran May 30 through August 30 plus Labor Day weekend, and the Village offered free memberships to qualifying residents 65 and older.247 The Village’s 2026 fee schedule: resident adult (16 to 61) $145 in season ($131 early bird in April; $75 from August 1), resident child (2 to 15) $135 ($121 / $70), resident senior 62+ and disabled resident $35, non-resident adult $235, non-resident child $210, babysitter badge $195, with a 3% convenience fee on credit card purchases.248 These are unchanged from 2023. For a family of four, two adults and two children come to $560 at the in-season rate, $504 at the early-bird rate.
Parking
Commuter and Central Business District permit prices are covered in §13. For carrying-cost purposes, an owner who commutes by train and cannot walk to the station should carry the annual Ridgewood resident commuter permit in the table below.
Homeowner’s and flood insurance
The last NAIC state table available to me puts New Jersey’s average HO-3 premium at $1,309 (2021 data, rank 23 of 51), against a national average of $1,411.249 That average covers every house in the state; a $1.4 million Ridgewood colonial insured to replacement cost will not be near it, and I will not invent a range.†
What is specific to Ridgewood’s housing stock and does move a quote: pre-war construction (knob-and-tube or cloth-wrapped wiring where never replaced), slate and tile roofs (higher replacement cost, and some carriers require an inspection or exclude them past a certain age), and underground heating-oil tanks, which most carriers will not insure for leakage and which many buyers require removed or tested before closing. None of these are exotic in Ridgewood; all of them are underwriting questions.
Flood insurance is required by federally regulated lenders only if the house sits in a FEMA Special Flood Hazard Area, and parts of Ridgewood along the Ho-Ho-Kus Brook and Saddle River do.† The FEMA Flood Map Service Center lookup by address is free and should be run before an offer, not after.
Electric and gas
PSE&G serves Ridgewood. Supply prices are set by the state’s annual Basic Generation Service auction, and the June 2025 result was the largest in memory. The BPU’s certified 2025 auction produced a 17.24% increase, $26.87 per month, for a PSE&G residential customer using 650 kWh, from $155.84 to $182.71 effective June 1, 2025; the Board attributed it to PJM’s capacity auction.250 The February 2026 auction reversed a sliver of that: a 1.8% decrease, $3.23 per month, to $180.23 for the same customer effective June 1, 2026.251 The Board also authorized a one-time $25 residential credit in August 2026, funded from clean-energy and solar compliance accounts, after two $30 credits in July and August 2025.252 Net: PSE&G supply is about 15.6% above where it stood in May 2025, and the 2026 relief is smaller than the 2025 relief. A 4-bedroom colonial with central air will use more than 650 kWh in summer months.†
Typical annual carrying cost beyond principal, interest and taxes
Hypothetical: a $1.4 million, 4-bedroom, 1930s colonial on a 5/8” or 3/4” meter, family of four, one train commuter. Each line is either cited or flagged; the flagged lines are shown blank on purpose.
| Line | Annual | Basis |
|---|---|---|
| Water (25,000 gal/qtr, 2026 H2 rates), 5/8” meter | $1,008 | Computed from Ord. 4085 rates253 |
| Water, same use, 3/4” meter | $1,168 | Computed from Ord. 4085 rates254 |
| of which PFAS surcharge, 5/8” / 3/4” | $163 / $245 | Ord. 4085 rates255 |
| Sewer | $0 separate; in tax rate | Code §238-59A256 |
| Garbage, recycling, bulk, leaves | $0 separate; in tax rate | Code Ch. 165, §145-4257258 |
| Electric, PSE&G, at BPU 650 kWh benchmark, June 2026 | $2,163 | $180.23 × 12259; actual use likely higher |
| Natural gas, PSE&G | † | BPU BGSS order needed |
| Homeowner’s insurance | † | NJ 2021 all-home average $1,309260; not applicable to this house |
| Flood insurance, only if in SFHA | † | FEMA Risk Rating 2.0 NJ data needed |
| Lead service line assessment, if opted into 30-year financing | ~$267 | Ridgewood Water example, $5,000 job261 |
| Graydon Pool, family of four, 2026 in-season rate | $560 | Village 2026 fee schedule262 |
| Commuter parking permit | see §13 | |
| Tree, soil, engineering and permit fees | project-dependent | §145-6, Ord. 4102263264 |
| Cited subtotal (5/8” meter, no gas, no insurance, no LSL) | $3,731 |
The subtotal is deliberately incomplete. Gas and insurance are the two largest missing lines, and on a house of this size and age each is plausibly larger than the water line. The number to take from this table is not the subtotal. It is that the fixed, non-negotiable Village-and-utility charges on a Ridgewood house run roughly $3,000 to $4,000 a year before insurance, before heating, and before anything breaks, and that the water portion has been rising 8 to 9 percent a year with a treatment program not yet finished.
What I tell my buyers: two questions for the seller’s disclosure that are not on the standard form. Is there an oil tank, above or below ground, active or abandoned? And what is the water service line made of? The first decides whether you can insure the house and at what price. The second decides whether you inherit a 30-year assessment or a $5,000 invoice in the next five years.
† Figures marked with a dagger are best-effort research, so verify them with the issuing office (the Village of Ridgewood, the school district, the county, the state or the utility) before making judgment calls or decisions on them.
17. Reasons Not to Buy Here
A report that only makes the case for a town is a brochure. Every item below is drawn from a figure elsewhere in this report, with the section it comes from. None of it is a characterization; each is a number and where it points.
1. You will pay more than the listing says, twice
The seller’s tax bill on the listing sheet reflects an assessment set in 2013. The typical buyer in 2025 and 2026 is assessed at 50.9 percent of what they paid against a Village ratio of 60.52 percent, which on revaluation arithmetic is a share increase near 19 percent before any budget growth (Section 2). Then the budgets grow: the school levy rose 4.0 percent for 2026 to 2027 and the municipal levy 3.98 percent for 2026, both above the nominal 2 percent cap through permitted exclusions (Sections 6 and 7). Model 1.944 percent of purchase price, then add 4 to 5 percent a year.
2. The tax bill is the highest in its peer group
Ridgewood’s 2025 average residential bill of $20,596 is the highest of the six towns compared (Glen Rock $20,141, Ho-Ho-Kus $19,834, Wyckoff $16,425, Midland Park $14,908, Paramus $13,061), 45 percent above the Bergen County average and 58 percent above Wyckoff, whose average sale price is comparable (Section 6). The ratable base is 86.5 percent residential; there is no commercial base to absorb levy growth, and the one large new ratable, the former Valley Hospital campus, was ruled exempt pending appeal in May 2026. If that ruling holds, about $5.3 million a year (3 percent of the levy) shifts back onto homeowners in the same year the revaluation lands (Section 6).
3. The school district has spent its cushion
Enrollment has declined seven consecutive years, 5.0 percent from the 2019 to 2020 peak, unevenly by building (Travell down 16.7 percent, Benjamin Franklin down 10.3 percent over three years). Per-pupil spending is the lowest of the six neighboring districts and below the state average. Employee benefits have risen from 21.3 to 29.5 percent of salaries across four budget years. The maintenance, legal and emergency reserves are budgeted to near zero by June 2027 and the capital reserve to $6.4 million from $9.9 million; the next significant facilities need is a levy or referendum item (Section 7). None of this appears in a consumer rating.
4. Inventory is not a market, it is a queue
Twelve active listings on August 29, 2026 against 18.9 closings a month is 0.64 months of supply. One listing sat between $1.2 million and $1.8 million, the band that accounts for a quarter of all sales. In the $800,000 to $1.8 million range an offer at asking price is roughly a 15th-percentile offer; 55 percent of closings were at or above 110 percent of list and 28 percent at or above 120 percent (Sections 3 to 5). A buyer who needs an inspection contingency, a mortgage contingency and two showings is competing against buyers who need none of those.
5. The top of the market is illiquid
Above $2.5 million, homes sold at 100.2 percent of asking with a median 14 days to contract, but active inventory in that band sits a median 92 days and represents a third of all listings against 9 percent of sales. Five-plus-bedroom homes closed at 104.8 percent of asking against 112.5 percent for three- and four-bedroom homes (Section 5). Appreciation and liquidity are not the same number here, and a buyer above $2.5 million who may need to sell inside five years is buying the slower asset.
6. The commute is a two-seat ride with a $1,500 parking line
No train from Ridgewood goes to New York Penn Station; every train terminates at Hoboken, and Manhattan requires a transfer at Secaucus or a PATH ride. NJ Transit fares now rise 3 percent every July 1 without a hearing. The Village-owned station lot requires a resident Premium Permit at $1,500 a year (2026), roughly five to twenty times what neighboring boroughs charge on secondary figures, and whether one is available is not published (Section 13). Commuter-rail use by Ridgewood workers fell from 1,408 to 758 between the 2015 to 2019 and 2020 to 2024 ACS periods while work-from-home rose from 11.1 to 32.1 percent (Section 15); the parking economics were set for the old commute.
7. The house is old and the systems are older
Sixty-one percent of what sold since 2021 was built before 1950 and 84 percent before 1960 (Section 12). Buried oil tanks, galvanized supply lines, cast iron drains at end of life, knob-and-tube and aluminum wiring, asbestos, and slate roofs are the ordinary findings, in a market where inspection contingencies are routinely waived. The state’s UST fund is accepting applications it will not process for an estimated 3.5 years; a leaking tank is an owner-funded remediation (Section 12). Ridgewood Water reported 1,708 lead and 1,286 galvanized service lines in 2023; the private side is the owner’s cost, financed as a 30-year assessment that transfers with the property, with a 2031 statutory deadline (Sections 12 and 16).
8. Water is under a consent order and the surcharge is permanent
Ridgewood Water has been out of compliance with the state’s PFOA and PFOS standards since 2020 and remained so at 18 points of entry as of July 16, 2026, with the last of twelve treatment plants due in the first quarter of 2027. The PFAS surcharge on a 5/8-inch meter has risen 189 percent since early 2024 and the total modeled bill 33 percent in thirty months; roughly $80 million of bonds and loans will be amortized through the facility fee and surcharge for decades (Section 16). Sewer is inside the tax rate, which is one reason the bill in item 2 looks the way it does.
9. Two rivers run through it
The Saddle River and the Ho-Ho-Kus Brook both carry Zone AE flood hazard areas through the Village. The USGS gauge at Ridgewood recorded its highest flow in 55 years during Ida (September 2, 2021), and ZIP 07450 has 415 NFIP claims on record, 50 of them from Ida and 130 from Irene. Since July 2023 any teardown or substantial improvement in the flood hazard area must be built three feet above the FEMA base flood elevation (Section 12). Consumer flood scores frequently disagree with the FEMA map in both directions; the map governs insurance and disclosure.
10. The zoning is tighter than the lot
On a typical 75 by 125 R-2 lot (which is itself below the 10,500 square-foot minimum), the 20 percent footprint cap binds before the gross building area schedule, and an ordinary one-story family-room addition on a 1920s colonial is over the line by nine square feet. On a 50 by 100 R-3 lot the all-floors cap is 1,750 square feet, which most existing houses already exceed. The Council has tightened the bulk table four times since 2007 and the next tightening, if the variance record shows coverage as the dominant category, is the likely response (Section 11). Buy the house you want, not the house you plan to make.
11. The downtown edge is about to change
Ordinances 4071 through 4075 (February 2026) put 20 units per acre across the B-1 and B-2 districts, 24 on the west side of South Broad Street, 30 on Chestnut Street including the Village’s own Street Department yard, 15 at 299 Goffle Road and an assisted-living building at North Maple and Franklin, with a 20 percent affordable set-aside on any five-plus-unit project needing a variance anywhere in the Village. Whether the Village holds builder’s-remedy immunity depends on a compliance certification this report could not confirm (Section 10). All of it is in census tract 474 (Section 14).
12. The downtown vacancies doubled in 2024 and no count has been published since
The Ridgewood Guild’s count went from 12 vacant storefronts in January 2024 to 23 in July 2024; no denominator and no later count is published (Section 9). The pedestrian plaza has been started, cut and suspended three times since 2020 and has not run since 2023. The Fourth of July fireworks are run by a private nonprofit that cancelled the 2026 show for weather without refunds (Section 9).
13. The last downturn took seven years to round-trip
Between 2006 and 2012 the median Ridgewood sale price fell about 13 percent, sales volume fell by more than a quarter, and homes took five to eight weeks to sell at 96 to 97 percent of asking. An owner who bought at the 2006 peak and had to sell before 2013 took a loss (Section 5). Today’s market has moved 64 percent in five years; it has not been tested since.
18. How Ridgewood Compares
Most Ridgewood buyers are also looking at Glen Rock, Ho-Ho-Kus, Wyckoff or Midland Park, and a few at Paramus. This table puts the six towns side by side on the things that can be measured the same way for all of them. Every row uses one source for all six towns, so the comparison is fair even where the number is unflattering.
The comparison
| Ridgewood | Glen Rock | Ho-Ho-Kus | Wyckoff | Midland Park | Paramus | |
|---|---|---|---|---|---|---|
| Average sale price, 2025 | $1,345,963 | $1,030,425 | $1,285,829 | $1,121,234 | $760,030 | $1,222,160 |
| Average residential tax bill, 2025 | $20,596 | $20,141 | $19,834 | $16,425 | $14,908 | $13,061 |
| Effective tax rate (on market value) | 1.94% | 2.44% | 1.71% | 1.71% | 2.37% | 1.43% |
| Next revaluation | 2027 | 2027 | done 2026 | 2027 | 2027 | done 2026 |
| School district | K-12 | K-12 | K-8, high school at Ridgewood HS | K-8, high school at Ramapo Indian Hills | K-12 | K-12 |
| Per-pupil spending, 2024-25 | $19,713 | $20,084 | $20,354 | $20,428 | $25,732 | $23,990 |
| Train station | Yes, Main and Bergen lines, zone 9 | Yes, two stations, zone 8 | Yes, zone 10 | No | No | No |
| Direct bus to Port Authority | Yes (163, 164) | Yes (163) | † | † | Yes (164) | Yes (168) |
| Water utility | Ridgewood Water | Ridgewood Water | † | Ridgewood Water | Ridgewood Water | † |
| Property offenses per 1,000 residents, 2025 | 4.8 | 6.2 | 1.4 | 3.8 | 6.9 | † |
| Violent offenses per 1,000 residents, 2025 | 0.3 | 0.3 | 0.0 | 0.2 | 0.3 | † |
| Median sale price and days on market, 2026 | $1,460,000 · 11 days | † | † | † | † | † |
Sale prices and tax figures: New Jersey Division of Taxation, 2025 General Tax Rates and 2025 Average Residential Statistics. Revaluation schedule: Bergen County Board of Taxation, January 7, 2026. Per-pupil spending: each district’s 2026-27 User Friendly Budget as filed with the NJ Department of Education (comparable operating cost per pupil, 2024-25 actual). Rail and bus: NJ Transit. Offense rates: FBI Crime Data Explorer, calendar 2025, on the FBI’s population figure for each agency; Ho-Ho-Kus reported all twelve months for the first time in 2025. Paramus is not in the offense comparison because it was outside the report’s police-data pull. The peer-town median price and days-on-market row is a pending NJMLS export.
How to read it
On price, Ridgewood is the most expensive of the six by average sale, and by a margin. Ho-Ho-Kus is closest, then Paramus and Wyckoff. Glen Rock, the town most often cross-shopped with Ridgewood, trades about 23 percent lower on average.
On taxes, the headline and the rate tell different stories. Ridgewood has the highest average bill because it has the most expensive houses. Measured as a share of what a buyer pays, its effective rate sits in the middle: lower than Glen Rock and Midland Park, higher than Ho-Ho-Kus, Wyckoff and Paramus. Paramus’s low rate comes from the Route 17 and Route 4 commercial base, which Ridgewood does not have. A buyer choosing between a $1.2 million house in Ridgewood and one in Glen Rock should expect the Ridgewood tax bill to be lower, not higher, on the same price.
Ho-Ho-Kus and Wyckoff do not run their own high schools. Ho-Ho-Kus students attend Ridgewood High School on a tuition basis; Wyckoff students attend the Ramapo Indian Hills regional district. For a family choosing on schools, that makes Ho-Ho-Kus a Ridgewood-high-school town with a lower tax bill and no train parking problem, at the cost of a smaller K-8 system. Section 7 has the Ridgewood figures.
Ridgewood spends the least per pupil of the six, and Midland Park the most. Per-pupil spending is a cost figure, not a quality figure, and small districts run higher per-pupil costs by arithmetic; it belongs in a tax conversation more than a schools conversation.
On the commute, only three of the six have a station, and Ridgewood’s is the one with the most trains, the ADA-accessible platforms and the most expensive parking. Glen Rock’s two stations are one fare zone cheaper. Wyckoff, Midland Park and Paramus are bus or drive-to-station towns.
Four of the six share a water utility, so the PFAS program and its surcharge described in Section 16 are not a Ridgewood-only cost; a Glen Rock, Wyckoff or Midland Park buyer carries the same line.
What the next quarterly edition adds
The peer-town sale price and days-on-market row, from the same NJMLS closed-sales method used for Ridgewood in Section 3, so that the six towns can be compared on how competitive they are and not only on what they cost.
† Figures marked with a dagger are best-effort research, so verify them with the issuing office (the Village of Ridgewood, the school district, the county, the state or the utility) before making judgment calls or decisions on them.
19. What Your Budget Buys
“What does a million dollars get me in Ridgewood?” is the question behind most first conversations. Here is the answer from what actually closed in 2025 and 2026, at three budgets, from the county deed record. Each column describes the typical home that sold within 10 percent of that price: the middle of the range, with the quarter-to-three-quarter spread where it helps.
| About $1.0 million | About $1.4 million | About $2.0 million | |
|---|---|---|---|
| Bedrooms | 3 (some 4) | 4 (some 3) | 4 to 5 |
| Bathrooms | 2 | 2 to 2.5 | 3 |
| Living space | about 1,800 sq ft (1,600 to 2,100) | about 2,400 sq ft (2,000 to 2,700) | about 3,100 sq ft (2,700 to 3,400) |
| Lot | about 9,200 sq ft (0.21 acre) | about 10,500 sq ft (0.24 acre) | about 15,000 sq ft (0.34 acre) |
| Year built | 1950 (1930 to 1957) | 1935 (1924 to 1952) | 1928 (1919 to 1951) |
| Most common styles | Colonial, split level, cape | Colonial, then split, Tudor, cape | Colonial, then Tudor, ranch |
| Price per square foot | about $540 | about $565 | about $650 |
| Where these homes are | North and east side (Glen Avenue, Travell area), east and south side (Hawes, Somerville areas), downtown blocks | Spread across the Village; north and east, west side below the Heights, and the south | Upper Ridgewood and the Heights first, then the west side above Hillcrest and the east |
| What you are competing against | The most contested band in the Village: 85% sell above asking, 11% over is typical | Still contested: 86% sell above asking, 13% over is typical | Contested, but with more room: 76% sell above asking, 11% over is typical |
| Expect to bring | Asking plus about 11%, and a fast decision | Asking plus about 12 to 13% | Asking plus about 11%; terms matter as much as price |
Closed sales January 2025 through August 2026 within 10 percent of each budget. Living space is the assessor’s building area and understates finished basements and attics. Competition figures from Section 3.
Reading the three columns
A million dollars buys a three-bedroom, post-war house on a fifth of an acre. Most often a cape, split or small colonial from the 1930s to 1950s, in the northern and eastern parts of the Village. At this budget you are in the most competitive band in Ridgewood and almost never alone.
$1.4 million buys the classic Ridgewood house: a four-bedroom pre-war colonial on a quarter acre. The median year built drops to 1935, which is where Section 12’s inspection list (oil tank, galvanized pipe, cast iron drains, original windows) applies in full. Price per square foot barely moves from the $1.0 million tier; you are paying for a fourth bedroom and 600 more square feet, not for a different kind of house.
$2.0 million buys four or five bedrooms, three baths and a third of an acre, and it buys location. Upper Ridgewood and the Heights account for the largest share of sales at this price. Price per square foot jumps to about $650, which is the premium for the large-lot zones (R-1, R-110, R-125) and the older, larger houses on them. This is also where the market begins to negotiate; Section 5 explains why.
What does not change across the three columns: the age of the house. At every budget the typical Ridgewood home was built before 1950. A buyer who wants new construction is choosing from a very small pool (Section 12) and paying the teardown economics described in Section 11.
What I tell my buyers: if the difference between your budget and the next tier up is $300,000, know what that $300,000 buys before you stretch. Between $1.0 and $1.4 million it buys a bedroom and 600 square feet. Between $1.4 and $2.0 million it buys 700 square feet, a third more land, and a different part of town. Only one of those is worth stretching for, and which one depends on you.
20. Your First 90 Days as a Ridgewood Owner
Most of this report is about getting the house. This page is about the first three months after you have it: the deadlines that are easy to miss and the calls that are easier to make now than later. Dates are Village or state schedules as of September 2026; confirm the current year’s dates with the office named.
Before closing
- Smoke, carbon monoxide and fire extinguisher certificate. The seller obtains it from the Bureau of Fire Prevention (201-444-7898). Ridgewood does not issue a certificate of occupancy for a one- or two-family resale; this certificate is the only Village document required. Ask to see it. (Section 12)
- Ridgewood Water final read. The seller schedules it three to five days before closing (201-670-5520). Confirm it was done so the first bill is yours alone. (Section 12)
- Look up the service line. Ridgewood Water publishes a lookup tool showing whether the line to the house is lead, galvanized or unknown, and whether a 30-year replacement assessment is already recorded against the property. Your attorney should search for the assessment the same way as any municipal lien. (Sections 12, 16)
- Ask two questions the disclosure form does not. Is there an oil tank, above or below ground, active or abandoned? What is the water service line made of? (Section 16)
- Run the flood map. FEMA’s Map Service Center by address, free. If the house is in a Special Flood Hazard Area, a federally regulated lender requires flood insurance, and the seller’s disclosure must say so under the March 2024 law. (Section 12)
The first month
- Garbage and recycling. Twice-weekly rear-yard pickup: Monday and Thursday west of Maple Avenue, Tuesday and Friday east of it. Bulk items on alternating Wednesdays, seven items, nothing over 100 pounds. Recycling on an eight-area calendar; the Village posts the map. No fee. (Section 16)
- Register on Community Pass. It is the Village’s platform for Graydon Pool, tennis and pickleball, day camp and recreation programs. Parents and children only on one account; grandparents and caregivers need their own. (Section 9)
- Parking. Downtown lots and the station lot are permit or kiosk parking; overnight permits exist for downtown residents without off-street parking. Check the Village parking page for the rules on your block. If you commute by train, see the December item below and make the call now. (Section 13)
- Trees. Removing any tree 8 inches or more in diameter on your own lot needs a Village permit and a replacement tree. Find that out before the landscaper does. (Section 11)
- Property tax bill. Quarterly, due February 1, May 1, August 1 and November 1. The 2026 bill you inherit is the seller’s assessment; the 2027 bill will be the revaluation’s. Run the Section 2 calculation now so it is not a surprise. (Sections 2, 6)
Dates that come around once a year
| When | What | Why it matters |
|---|---|---|
| Mid-December | Commuter parking permits go on sale for the following year, in person at Village Hall | Premium permits have been capped; the waitlist is not published. Call the Parking Utility (201-670-5500 ext. 2200) the month you close, not in December. (Section 13) |
| April 1 to 30 | Graydon Pool early-bird badge rate ($131 adult, $121 child, resident) | Saves about 10 percent on a family of four. (Section 9) |
| May 1 | Property tax appeal deadline in a revaluation year (not April 1) | Miss it and the year is forfeited. Confirm the date with the Bergen County Board of Taxation each year. (Section 2) |
| Late May | Graydon opens (May 30 in 2026); Ridgewood Run on Memorial Day | (Section 9) |
| June | Farmers market opens, Sundays at the station lot | (Section 9) |
| July 1 | NJ Transit fares rise 3 percent, automatically, every year | A monthly pass bought in 2029 costs about 9 percent more than one bought today. (Section 13) |
| July 4 | Parade at 10 am; evening program and fireworks are run by a private nonprofit, ticketed, and weather-dependent | (Section 9) |
| Late October to early December | Leaf collection windows, posted by the Village each October; loose leaves at the curb only during your area’s dates, 10 feet from a storm drain | Fines up to $2,000. (Section 16) |
| November 2 (2026) | Deadline for the state’s ANCHOR, Senior Freeze and Stay NJ property tax relief applications (Form PAS-1) | Worth $1,000 to $6,500 a year to owners who qualify. (Section 6) |
| Early December | Downtown tree lighting at Van Neste Square | (Section 9) |
If you plan to renovate
Before you hire an architect, get three numbers for your lot: its area, the existing footprint of the house, and the existing gross building area (all floors, including the attached garage and any attic with seven feet of clearance). Those three numbers against the Section 11 tables tell you whether your project is a permit or a hearing. Adding more than 200 square feet of paving or patio now triggers a $300 engineering review on top of the building permit. Any teardown or substantial renovation in the flood zones must be built three feet above the FEMA base flood elevation.
What I tell my buyers: the parking call and the flood map are the two things to do the week you go under contract, not the week you move in. Everything else on this page can wait for the boxes to be unpacked.
21. A Worked Example: What a $1.4 Million Ridgewood Home Costs to Own
Section 19 describes the typical $1.4 million purchase: a four-bedroom colonial built around 1935 on a quarter acre. This page adds up what it costs to own, line by line, using the figures from the rest of this report. Where a line depends on the buyer (the mortgage rate, the insurance quote), the assumption is stated so you can substitute your own.
Assumptions: purchase price $1,400,000; 20 percent down; a 30-year fixed mortgage of $1,120,000 at 6.5 percent (an illustration, not a quote; substitute the rate you are offered); one train commuter; family of four; 5/8-inch water meter; the house is not in a flood zone.
Year one
| Line | Monthly | Annual | Where it comes from |
|---|---|---|---|
| Principal and interest | $7,079 | $84,948 | Standard amortization at the assumed rate |
| Property tax, year one | $1,717 | $20,600 | Typical 2025-26 buyer: assessed at about half of price, at the 2025 rate (Section 2) |
| Homeowner’s insurance | † | † | Two or three carrier quotes; pre-war house, possible slate roof and tank history move the number (Section 16) |
| Water, 25,000 gallons a quarter | $84 | $1,008 | Ridgewood Water 2026 rates, including the PFAS surcharge (Section 16) |
| Sewer, garbage, recycling, leaves | $0 | $0 | Inside the tax bill (Section 16) |
| Electric, PSE&G benchmark | $180 | $2,163 | BPU 650 kWh benchmark; a colonial with central air runs higher in summer (Section 16) |
| Natural gas | † | † | BPU gas supply order (Section 16) |
| Station parking, resident Premium permit | $125 | $1,500 | If one is available; call first (Section 13) |
| NJ Transit monthly pass, Ridgewood to New York | $362 | $4,344 | Fare effective July 1, 2026; $300 a month to Hoboken (Section 13) |
| Graydon Pool, family of four | $47 | $560 | 2026 in-season rate; $504 early bird (Section 9) |
| Lead service line, if financed | $22 | $267 | Only if the line is lead or galvanized and you take the 30-year assessment (Section 16) |
| Cited subtotal, excluding insurance and gas | $9,616 | $115,390 |
Add a maintenance reserve. A common rule for a pre-war house is 1 to 2 percent of value a year, which on this house is $14,000 to $28,000; that is a planning figure, not a bill, and Section 12 lists what it tends to get spent on.
Year two and after: the revaluation
The year-one tax line is the number a buyer inherits from the seller’s assessment. It does not survive the 2027 revaluation. For the typical recent buyer, assessed at about 51 percent of price against a Village ratio of 60.5 percent, the reset moves the bill up by roughly 19 percent, before any budget growth (Section 2).
| Property tax | Annual | Monthly |
|---|---|---|
| Year one, on the seller’s assessment | $20,600 | $1,717 |
| 2027, after the revaluation, same levy | about $24,500 | about $2,040 |
| 2028, adding 4 to 5 percent a year of levy growth (Sections 6, 7) | about $25,600 | about $2,130 |
The conservative planning figure used in Sections 2 and 6, about 1.94 percent of purchase price, gives $27,200 a year; it is the Village-wide average and slightly above what this specific buyer should expect, which is why it is the right number to budget with.
What the example says
The mortgage is three-quarters of the monthly cost, and nothing in this report changes it. The tax line is the one that changes, and it changes in a known direction on a known date; a buyer who budgets $1,700 a month for taxes in 2026 and $2,100 in 2028 is not surprised. The Village and utility lines together, water, parking, pool and the lead line, run about $3,300 a year on this house, and the water portion has been rising 8 to 9 percent a year with the treatment program not yet finished. The train pass and the parking permit together are about $5,800 a year, more than the water bill and the pool combined. Insurance and gas are the two lines this report cannot fill in for you, and on a house of this age each is plausibly larger than the water bill.
What I tell my buyers: the lender qualifies you on principal, interest, taxes and insurance. Ridgewood adds three lines the lender never sees: the 2027 tax reset, the parking permit, and the water bill. Put all three in the spreadsheet before the offer, and the spreadsheet will be right for the next five years.
† Figures marked with a dagger are best-effort research, so verify them with the issuing office (the Village of Ridgewood, the school district, the county, the state or the utility) before making judgment calls or decisions on them.
Data & Citations
This is how we underwrite a town. Public records, proprietary MLS sales data, and sources that never make it online — read in full, cross-checked against each other, and weighed with the judgment of a principal who has put his own capital behind this work. Every figure traces to a source: the materials below are grouped by the section they support, and numbered footnotes follow.
View source documents by section
Section 2
Sources: Village of Ridgewood Assessor’s Office and Appraisal Systems, Inc. (revaluation notice, March 20, 2026); New Jersey Division of Taxation, Certification of Average Ratios and Common Level Ranges for Tax Year 2026, Tables of Equalized Valuations 2018 to 2025, 2025 General Tax Rates and 2025 Average Residential Statistics, and revaluation history; Bergen County Board of Taxation, 2026 appeal deadlines and 2026 to 2027 revaluation schedule; Bergen County deed records for Ridgewood, 2025 to 2026 sales, analysis by Ashish Desai Group. Retrieved September 7, 2026.
Section 3
Sources: New Jersey Multiple Listing Service, closed residential sales in the Village of Ridgewood, January 1, 2021 through August 29, 2026, and NJMLS Statistics Report for Ridgewood, January 1, 2021 through September 7, 2026 (listing outcomes). Analysis by Ashish Desai Group. As of August 29, 2026.
Section 4
Sources: New Jersey Multiple Listing Service, closed residential sales in the Village of Ridgewood, January 1, 2025 through August 29, 2026. Analysis by Ashish Desai Group. As of August 29, 2026.
Section 5
Sources: New Jersey Multiple Listing Service, active and under-contract residential listings in the Village of Ridgewood as of August 29, 2026; closed sales January 1, 2025 through August 29, 2026; and closed sales January 1, 2006 through December 31, 2014. Analysis by Ashish Desai Group.
Section 6
Sources: New Jersey Division of Taxation, 2025 and 2024 General Tax Rates by County and Municipality; 2025 and 2024 Average Residential Statistics; 2025 Bergen County Abstract of Ratables; Tables of Equalized Valuations 2018 to 2025; 2026 Certification of Average Ratios and Common Level Ranges; Property Tax Appeals 2024 and 2025; NJ Department of Education, Ridgewood User-Friendly Budgets 2025-26 and 2026-27; Bergen County Board of Taxation, 2026 and 2027 Revaluations and Reassessments; NJ Division of Taxation, ANCHOR, Senior Freeze and Stay NJ program pages. Retrieved September 7, 2026.
Section 7
Sources cited in Section 7
- New Jersey Department of Education. School Performance Report 2023-2024, Ridgewood Public School District (03-4390), District Detail. https://www.nj.gov/education/sprreports/202324/District-Detail/03-4390.pdf. Retrieved September 7, 2026.
- New Jersey Department of Education. School Performance Report 2023-2024, Ridgewood Public School District, District Summary. https://www.nj.gov/education/sprreports/202324/District-Summary/03-4390.pdf. Retrieved September 7, 2026.
- New Jersey Department of Education, Office of School Finance. 2026-27 User Friendly Budget, Bergen, Ridgewood Village (4390). https://www.nj.gov/education/budget/ufb/2627/reports/03/UFB27_4390.pdf. Retrieved September 7, 2026.
- Ridgewood Board of Education. Annual Comprehensive Financial Report, fiscal year ended June 30, 2025, as filed with NJ DOE. https://www.nj.gov/education/finance/fp/acfr/search/25/4390.pdf. Retrieved September 7, 2026.
- NJ DOE. School Performance Report 2023-2024, Hawes Elementary School (03-4390-085). https://www.nj.gov/education/sprreports/202324/School-Detail/03-4390-085.pdf. Retrieved September 7, 2026.
- NJ DOE. School Performance Report 2023-2024, Orchard Elementary School (03-4390-120). https://www.nj.gov/education/sprreports/202324/School-Detail/03-4390-120.pdf. Retrieved September 7, 2026.
- NJ DOE. School Performance Report 2023-2024, Ridge Elementary School (03-4390-090). https://www.nj.gov/education/sprreports/202324/School-Detail/03-4390-090.pdf. Retrieved September 7, 2026.
- NJ DOE. School Performance Report 2023-2024, Somerville Elementary School (03-4390-100). https://www.nj.gov/education/sprreports/202324/School-Detail/03-4390-100.pdf. Retrieved September 7, 2026.
- NJ DOE. Fall Enrollment Reports (statewide totals and district/school enrollment workbooks, 2020-21 through 2025-26). https://www.nj.gov/education/doedata/enr/. Retrieved September 7, 2026. (Zip workbooks not parsed; used for the statewide context only.)
- NJ DOE. School Performance Report 2023-2024, Travell Elementary School (03-4390-110). https://www.nj.gov/education/sprreports/202324/School-Detail/03-4390-110.pdf. Retrieved September 7, 2026.
- NJ DOE. School Performance Report 2023-2024, Willard Elementary School (03-4390-130). https://www.nj.gov/education/sprreports/202324/School-Detail/03-4390-130.pdf. Retrieved September 7, 2026.
- NJ DOE. School Performance Report 2023-2024, Benjamin Franklin Middle School (03-4390-060) and George Washington Middle School (03-4390-070). https://www.nj.gov/education/sprreports/202324/School-Detail/03-4390-060.pdf and https://www.nj.gov/education/sprreports/202324/School-Detail/03-4390-070.pdf. Retrieved September 7, 2026.
- NJ DOE. School Performance Report 2023-2024, Ridgewood High School (03-4390-050), School Detail and School Summary. https://www.nj.gov/education/sprreports/202324/School-Detail/03-4390-050.pdf and https://www.nj.gov/education/sprreports/202324/School-Summary/03-4390-050.pdf. Retrieved September 7, 2026.
- National Center for Education Statistics, Common Core of Data, school listing for Ridgewood Public School District (NCES 3413830), 2024-25 membership as reported by NJ DOE. https://nces.ed.gov/ccd/schoolsearch/school_list.asp?Search=1&DistrictID=3413830. Retrieved September 7, 2026.
- NJ DOE. 2025 Taxpayers’ Guide to Education Spending (indicator definitions). https://www.nj.gov/education/guide/2025tges.shtml. Retrieved September 7, 2026.
- NJ DOE. 2026-27 User Friendly Budget, Glen Rock Boro (1760). https://www.nj.gov/education/budget/ufb/2627/reports/03/UFB27_1760.pdf. Retrieved September 7, 2026.
- NJ DOE. 2026-27 User Friendly Budget, Ho-Ho-Kus Boro (2200). https://www.nj.gov/education/budget/ufb/2627/reports/03/UFB27_2200.pdf. Retrieved September 7, 2026.
- NJ DOE. 2026-27 User Friendly Budget, Wyckoff Twp (5920). https://www.nj.gov/education/budget/ufb/2627/reports/03/UFB27_5920.pdf. Retrieved September 7, 2026.
- NJ DOE. 2026-27 User Friendly Budget, Midland Park Boro (3170). https://www.nj.gov/education/budget/ufb/2627/reports/03/UFB27_3170.pdf. Retrieved September 7, 2026.
- NJ DOE. 2026-27 User Friendly Budget, Paramus Boro (3930). https://www.nj.gov/education/budget/ufb/2627/reports/03/UFB27_3930.pdf. Retrieved September 7, 2026.
- NJ DOE. Press release, Murphy Administration Announces 2025 Taxpayers’ Guide to Education Spending, December 9, 2025 (state average budgetary cost per pupil $21,199 for 2024-25 budgeted, up $1,913 from 2023-24 actual; total spending per pupil $29,978 for 2023-24). https://www.nj.gov/education/news/2025/MurphyAdministrationAnnounces2025TaxpayersGuideToEducationSpending.pdf. Retrieved September 7, 2026. The 2023-24 state actual of $19,286 is derived from those two figures.
- NJ DOE. 2025 Taxpayers’ Guide to Education Spending, Summary, Regular Districts, 2023-24 Actual. https://www.nj.gov/education/guide/docs/2025/SUMYR4.HTM. Retrieved September 7, 2026. (Ridgewood total budgetary cost $102,417,720 on average daily enrollment 5,491.6, which reproduces the $18,650 per-pupil figure in source 3.)
- NJ DOE. 2025 Taxpayers’ Guide to Education Spending, Summary, Regular Districts, 2024-25 Budgeted. https://www.nj.gov/education/guide/docs/2025/SUMYR5.HTM. Retrieved September 7, 2026.
- NJ DOE. School Performance Report 2022-2023, Ridgewood High School (03-4390-050). https://www.nj.gov/education/sprreports/202223/School-Detail/03-4390-050.pdf. Retrieved September 7, 2026.
- NJ DOE. 2025-26 User Friendly Budget, Ridgewood Village (4390). https://www.nj.gov/education/budget/ufb/2526/reports/03/UFB26_4390.pdf. Retrieved September 7, 2026.
- Ridgewood Board of Education. Regular Public Meeting Agenda, March 17, 2025 (tentative 2025-26 budget resolution and capital reserve withdrawals). https://files-backend.assets.thrillshare.com/documents/asset/uploaded_file/4358/Rps/c132a262-dd12-40ef-9b54-7737db1aa8c0/2025-03-17_Agenda_rev.pdf. Retrieved September 7, 2026.
- NJ DOE. 2024-2025 School Performance Reports Public Release, May 21, 2026. https://www.nj.gov/education/sleds/sledsnews/spr-public-release-may-2026.shtml. Retrieved September 7, 2026.
Sources: NJ Department of Education, School Performance Reports 2023-24 (district and nine school reports); NJ DOE User Friendly Budgets 2025-26 and 2026-27 (Ridgewood, Glen Rock, Ho-Ho-Kus, Wyckoff, Midland Park, Paramus); NJ DOE Taxpayers’ Guide to Education Spending 2025; Ridgewood Board of Education Annual Comprehensive Financial Report FY2025, as filed with NJ DOE; Ridgewood Board of Education agenda of March 17, 2025; NJ DOE fall enrollment 2024-25 via NCES. All retrieved September 7, 2026.
Sources: [3][25][26]
Section 8
Sources cited in Section 8
- Federal Bureau of Investigation, Crime Data Explorer, summarized agency data API, Ridgewood Police Department (ORI NJ0025100), offenses by month, January 2020 through December 2025: violent-crime, property-crime, burglary, larceny, motor-vehicle-theft, homicide, rape, robbery, aggravated-assault. Base URL pattern: https://api.usa.gov/crime/fbi/cde/summarized/agency/NJ0025100/{offense}?from=01-2020&to=12-2025 (web interface: https://cde.ucr.cjis.gov). CDE properties returned: max data date UCR 08/2026, last refresh 08/15/2026. Retrieved September 7, 2026.
- U.S. Census Bureau, QuickFacts, Ridgewood village, New Jersey, Population, Census, April 1, 2020: 25,979. https://www.census.gov/quickfacts/fact/table/ridgewoodvillagenewjersey/PST045224. Retrieved September 7, 2026.
- Federal Bureau of Investigation, Crime Data Explorer, agency list by state (New Jersey), NIBRS start dates for NJ0025100, NJ0022200, NJ0022800, NJ0027000, NJ0023500. https://api.usa.gov/crime/fbi/cde/agency/byStateAbbr/NJ. Retrieved September 7, 2026.
- Federal Bureau of Investigation, Crime Data Explorer, summarized state data API, New Jersey, violent-crime and property-crime, January 2021 through December 2025, including participated_population and Percent of Population Coverage fields. https://api.usa.gov/crime/fbi/cde/summarized/state/NJ/violent-crime?from=01-2021&to=12-2025 and …/property-crime?from=01-2021&to=12-2025. Retrieved September 7, 2026.
- New Jersey State Police, Uniform Crime Reporting, Uniform Crime Reports index (annual workbooks 2019 through 2023) and Current Crime Data (2024 first quarter, posted April 16, 2025). https://www.nj.gov/njsp/ucr/uniform-crime-reports.shtml and https://www.nj.gov/njsp/ucr/current-crime-data1.shtml. Workbook URLs: https://www.nj.gov/njsp/ucr/pdf/current/20250416_2023_Uniform_Crime_Report.xlsx ; https://www.nj.gov/njsp/ucr/pdf/current/20241101_2022_Uniform_Crime_Report.xlsx ; https://www.nj.gov/njsp/ucr/pdf/current/20241101_2021_Uniform_Crime_Report.xlsx ; https://www.nj.gov/njsp/ucr/pdf/current/2020_Uniform_Crime_Report.xlsx ; https://www.nj.gov/njsp/ucr/pdf/current/20250416_2024_Uniform_Crime_Report_1st_Quarter_Jan-March.xlsx. Retrieved September 7, 2026.
- Federal Bureau of Investigation, Crime Data Explorer, summarized agency data API, Glen Rock (NJ0022200), Ho-Ho-Kus (NJ0022800), Wyckoff Township (NJ0027000), Midland Park (NJ0023500), violent-crime, property-crime, burglary, larceny, motor-vehicle-theft, January 2021 through December 2025. Same URL pattern as source 1. Retrieved September 7, 2026.
- Federal Bureau of Investigation, Crime Data Explorer, Police Employee data API, Ridgewood Police Department (NJ0025100), 2019 through 2025. https://api.usa.gov/crime/fbi/cde/pe/agency/NJ0025100?from=2019&to=2025. Retrieved September 7, 2026.
- Village of Ridgewood, Police Department, Patrol Division. https://www.ridgewoodnj.net/357/Patrol-Division. Retrieved September 7, 2026.
Secondary, used only as a cross-check and not cited in the section: city-data.com, “Crime in Ridgewood, New Jersey,” year-by-year table 2011 through 2024 (https://www.city-data.com/crime/crime-Ridgewood-New-Jersey.html, retrieved September 7, 2026). Its 2021 through 2024 burglary, larceny, motor vehicle theft, and violent component counts match the CDE figures above exactly. Its 2024 employee figure (49 total, 44 officers) matches source 7.
Sources: FBI Crime Data Explorer, summarized agency data, ORIs NJ0025100, NJ0022200, NJ0022800, NJ0027000, NJ0023500, and New Jersey state series, 2020 through 2025; FBI CDE Police Employee data, NJ0025100; FBI CDE agency list for New Jersey (NIBRS start dates); U.S. Census Bureau QuickFacts, Ridgewood village; New Jersey State Police Uniform Crime Reporting (report availability); Village of Ridgewood, Patrol Division page. Retrieved September 7, 2026. All Village of Ridgewood staffing, budget, fire, and EMS figures pending.
Section 9
Sources cited in Section 9
All retrieved September 7, 2026.
Additional sources consulted: Village of Ridgewood 2022 Master Plan Final Draft (https://mods.ridgewoodnj.net/pdf/masterplan/RidgewoodMPFinalDraft08_23_22opt.pdf, not retrievable September 7, 2026); Village Agenda Center CBDAC minutes of March 13, 2025 and November 13, 2025, and Council agenda of January 14, 2026 (not retrievable); The Ridgewood Blog, “It’s Official: Ridgewood Crowned the #1 Downtown in Bergen County for 2026,” March 21, 2026 ((201) Magazine Best of Bergen award; consumer award, not used as evidence).
Sources: Village of Ridgewood (Parking, Recreation, archived CBDAC minutes, Village Code via ecode360); Ridgewood Public Library; Ridgewood Chamber of Commerce; Ridgewood Guild; Ridgewood Fourth of July Celebration, Inc.; North Jersey Masters Running Club; Bergen County Parks; Preservation New Jersey; U.S. Census Bureau geocoder; Ridgewood United; press reports (Patch, TAPinto, CBS New York, The Ridgewood Blog) where flagged. Retrieved September 7, 2026. Village-hosted documents require re-verification at publication.
Section 10
Sources cited in Section 10
| Agency / body | Document | URL | Retrieved |
|---|---|---|---|
| NJ Department of Community Affairs | Fair Share Housing Obligations for 2025-2035 (Fourth Round): Methodology and Background, Appendix A | https://www.nj.gov/dca/dlps/pdf/FourthRoundCalculation_Methodology.pdf | 2026-09-07 |
| Village of Ridgewood Planning Board (filed with NJ Superior Court, Bergen County, BER-L-000777-25) | 2025 Fourth Round Housing Plan, Housing Element & Fair Share Plan, adopted June 23, 2025, 67 pp. | https://library.njcourts.gov/files/civil/affordable-housing/bergen/ridgewood-village/4thRoundAdoptedHousingPlan.pdf?VersionId=qJM0rLzgMeq5v63LgSsE6x80xC6CVTy5 | 2026-09-07 |
| Village of Ridgewood Planning Board | Regular Public Meeting minutes, July 15, 2025 (mirrored copy) | https://assets.zyrosite.com/AoPJ9vDxvWiBl80a/_07152025-1121-A85VPD7gq6S7kGyZ.pdf (original: https://rpd.ridgewoodnj.net/AgendaCenter/ViewFile/Minutes/_07152025-1121) | 2026-09-07 |
| Village of Ridgewood | Ordinance No. 4071 (S-1 Senior Overlay), introduced Dec. 17, 2025 (mirrored copy) | https://assets.zyrosite.com/AoPJ9vDxvWiBl80a/4071-0PfoReexxtf5pkQW.pdf | 2026-09-07 |
| Village of Ridgewood | Ordinance No. 4072 (TO-1 Townhouse Overlay) (mirrored copy) | https://assets.zyrosite.com/AoPJ9vDxvWiBl80a/4072-8HuXonx1ONa3a9Bl.pdf | 2026-09-07 |
| Village of Ridgewood | Ordinance No. 4073 (C-R-1) (mirrored copy) | https://assets.zyrosite.com/AoPJ9vDxvWiBl80a/4073-IsRGgsIizAVqsTYj.pdf | 2026-09-07 |
| Village of Ridgewood | Ordinance No. 4074 (B-1/B-2) (mirrored copy) | https://assets.zyrosite.com/AoPJ9vDxvWiBl80a/4074-9CzZc3Mq6MkTXBxs.pdf | 2026-09-07 |
| Village of Ridgewood | Ordinance No. 4075 (mandatory set-aside) (mirrored copy) | https://assets.zyrosite.com/AoPJ9vDxvWiBl80a/4075-06Ei5ymjd670TzSC.pdf | 2026-09-07 |
| Fair Share Housing Center (advocacy organization, secondary) | Press release, Jan. 5, 2026, statewide settlement count; no Ridgewood mention | https://www.fairsharehousing.org/press-release/new-affordable-housing-law-delivers-results-nearly-all-nj-towns-resolve-challenges-by-dec-31-deadline/ | 2026-09-07 |
| Ridgewood United (resident group, secondary) | Past Events chronology; The Proposal; FAQs; home page | https://ridgewood-united.com/past-events ; https://ridgewood-united.com/the-proposal ; https://ridgewood-united.com/faqs ; https://ridgewood-united.com/ | 2026-09-07 |
| The Ridgewood Blog (secondary) | “Ridgewood Council Rejects Zoning Change…” Aug. 20, 2025; “Ridgewood Sued Over Affordable Housing Plan…” Sept. 4, 2025; “Village of Ridgewood Special Meeting” (Dec. 17, 2025 agenda); “Ridgewood Beats the Clock…” | https://theridgewoodblog.net/ridgewood-council-rejects-zoning-change-for-assisted-living-project-sparks-heated-debate/ ; https://theridgewoodblog.net/ridgewood-sued-over-affordable-housing-plan-after-council-rejects-senior-living-proposal/ ; https://theridgewoodblog.net/village-of-ridgewood-special-meeting/ ; https://theridgewoodblog.net/ridgewood-beats-the-clock-council-approves-high-stakes-affordable-housing-plan-to-avoid-builders-remedy/ | 2026-09-07 |
| Real Estate NJ (trade press, secondary) | “Onyx unveils 60-unit luxury apartment building in downtown Ridgewood,” Apr. 29, 2021 | https://re-nj.com/onyx-unveils-60-unit-luxury-apartment-building-in-downtown-ridgewood/ | 2026-09-07 |
| Patch (secondary) | “‘Chestnut Village’ Housing Development Proposed,” Oct. 2011 (ties the marketing name to Two-Forty Associates LLC) | https://patch.com/new-jersey/ridgewood/another-downtown-housing-development-proposed | 2026-09-07 |
Sources: NJ DCA, Fourth Round Obligation Report (Oct. 2024); Village of Ridgewood, 2025 Fourth Round Housing Element & Fair Share Plan (adopted June 23, 2025; filed BER-L-000777-25); Village Ordinances 4071–4075 (introduced Dec. 17, 2025); Ridgewood Planning Board minutes July 15, 2025. Retrieved September 7, 2026.
Section 11
Sources cited in Section 11
Sources: General Code eCode360, Village of Ridgewood Code, Chapter 190 (Land Use and Development) and Chapter 260 (Tree Protection, Removal, and Replacement), legislation through Ord. No. 4099; Village of Ridgewood, Fourth Round Housing Element and Fair Share Plan (adopted June 23, 2025), filed with the New Jersey Courts affordable housing library; N.J.S.A. 40:55D-70 and 40:55D-70.1; Redfin property records for the addresses listed. Retrieved September 7, 2026. Zoning Board application counts, fee amounts and deed figures require retrieval and verification before publication.
Sources: eCode360, Village of Ridgewood Code §§190-100 through 190-106 and §190-119, retrieved September 7, 2026.121122 R-4 (garden apartment) is a separate regime: 44,000 sf minimum lot, 20 units per acre, 30 ft and two stories, 25% coverage.123
Sources: Redfin property pages, retrieved September 7, 2026; all figures†.143
Section 12
Sources cited in Section 12
| Agency | Document | URL | Retrieved |
|---|---|---|---|
| U.S. EPA | Real Estate Disclosures about Potential Lead Hazards | https://www.epa.gov/lead/real-estate-disclosures-about-potential-lead-hazards | 2026-09-07 |
| U.S. EPA | Learn About Asbestos | https://www.epa.gov/asbestos/learn-about-asbestos | 2026-09-07 |
| U.S. CPSC | Repairing Aluminum Wiring (Pub. 516) | https://www.cpsc.gov/s3fs-public/516.pdf | 2026-09-07 |
| NJ DCA Division of Fire Safety | N.J.A.C. 5:70-2.3 (via Cornell LII) | https://www.law.cornell.edu/regulations/new-jersey/N-J-A-C-5-70-2-3 | 2026-09-07 |
| NJ DCA Division of Fire Safety | N.J.A.C. 5:70-2.9 fees (via Justia) | https://regulations.justia.com/states/new-jersey/title-5/chapter-70/subchapter-2/section-5-70-2-9 | 2026-09-07 |
| Village of Ridgewood | Code Ch. 149 Art. II Smoke Detectors | https://ecode360.com/6690353 | 2026-09-07 |
| Village of Ridgewood | Code Ch. 149 Art. III Underground Storage Tanks | https://ecode360.com/6690366 | 2026-09-07 |
| Village of Ridgewood | Code Ch. 145 Fees | https://ecode360.com/6690240 | 2026-09-07 (truncated online) |
| Village of Ridgewood | Code Ch. 154 Floodplain Management | https://ecode360.com/6690420 ; https://ecode360.com/37900956 | 2026-09-07 |
| Village of Ridgewood | Building and Inspection FAQs (archived site) | https://archive.ridgewoodnj.net/index.php?Itemid=1432&id=4277&option=com_content&view=article | 2026-09-07 |
| Ridgewood Water | Moving / Final Read Request | https://water.ridgewoodnj.net/moving/ | 2026-09-07 |
| Ridgewood Water | Lead Updates and Resources | https://water.ridgewoodnj.net/lead-updates-and-resources/ | 2026-09-07 |
| Ridgewood Water | LSL Progress Report to NJDEP, 7/7/2023 | https://water.ridgewoodnj.net/wp-content/uploads/2024/01/Appendix-C-Progress-Report-DEP-10s-00027-7.7.2023.pdf | 2026-09-07 |
| Ridgewood Water | Press release 2/17/2022 | https://water.ridgewoodnj.net/wp-content/uploads/2022/02/Press-Release-2.17.22-v3.pdf | 2026-09-07 |
| Ridgewood Water | NJWB Funding Notice, LSL Contract 1 | https://water.ridgewoodnj.net/wp-content/uploads/2025/09/NJWB-I-Bank-Funding-Notice-LSL-Replacements-Contract-1.pdf | 2026-09-07 |
| Ridgewood Water | Weekly Updates Q1 2026 | https://water.ridgewoodnj.net/wp-content/uploads/2026/03/Weekly-Updates-1st-Quarter-2026-2.pdf | 2026-09-07 |
| Ridgewood Water | LSL Replacement Program FAQ | https://leadreplacement.ridgewoodnj.net/pages/frequently-ask-questions | 2026-09-07 |
| NJ Infrastructure Bank | Ridgewood Village Lead Service Line Replacement | https://www.njib.gov/news/ridgewood-village-lead-service-line-replacement-698a0e5f5b8aa | 2026-09-07 |
| NJDEP | Known Contaminated Site List feature service (Environmental_NJEMS layer 0) | https://mapsdep.nj.gov/arcgis/rest/services/Features/Environmental_NJEMS/MapServer/0 | 2026-09-07 |
| NJDEP | KCSL metadata / field definitions | https://www.nj.gov/dep/gis/digidownload/metadata/html/Envr_NJEMS_KCSL.html | 2026-09-07 |
| NJDEP | 2015 Radon Tier Assignment Report | https://www.nj.gov/dep/rpp/radon/download/rtar2015.pdf | 2026-09-07 |
| NJDEP | UST Fund FAQ | https://www.nj.gov/dep/srp/finance/ustfund/ustfund_faq.htm | 2026-09-07 |
| NJDEP | N.J.A.C. 7:1E-5.3 discharge notification (via Cornell LII) | https://www.law.cornell.edu/regulations/new-jersey/N-J-A-C-7-1E-5-3 | 2026-09-07 |
| NJ Legislature | N.J.S.A. 26:2D-73 (via Justia) | https://law.justia.com/codes/new-jersey/title-26/section-26-2d-73/ | 2026-09-07 |
| Office of the Governor | Inland Flood Protection Rule filing, 6/6/2023 | https://www.nj.gov/governor/news/news/562023/20230606c.shtml | 2026-09-07 |
| FEMA | Flood Insurance Study, Bergen County 34003CV001B (rev. 8/28/2019) | https://map1.msc.fema.gov/data/34/S/PDF/34003CV001B.pdf | 2026-09-07 |
| FEMA | DR-4614-NJ Hurricane Ida | https://www.fema.gov/disaster/4614 | 2026-09-07 |
| FEMA | OpenFEMA FIMA NFIP Redacted Claims v2 | https://www.fema.gov/api/open/v2/FimaNfipClaims | 2026-09-07 |
| USGS | Peak streamflow, 01390500 Saddle River at Ridgewood | https://nwis.waterdata.usgs.gov/nwis/peak?site_no=01390500&agency_cd=USGS&format=rdb | 2026-09-07 |
| Day Pitney LLP (law firm summary) | New Flood Disclosure Requirements | https://www.daypitney.com/insights/publications/2024/03/20-new-flood-disclosure-requirements-nj-landlords-seller | 2026-09-07 |
| NJ REALTORS | Flood Disclosures | https://www.njrealtor.com/government-affairs/flood-disclosures/ | 2026-09-07 |
| Patch Ridgewood (news) | DEP Creating Interactive Flood Maps, 10/1/2012 | https://patch.com/new-jersey/ridgewood/dep-creating-interactive-maps-of-flood-prone-hhk-brooc4fcfda614 | 2026-09-07 |
| The Ridgewood Blog (news/blog) | Hurricane Ida tag | https://theridgewoodblog.net/nj/hurricane-ida/ | 2026-09-07 |
Sources: EPA; U.S. Consumer Product Safety Commission; NJ Division of Fire Safety, N.J.A.C. 5:70; Village of Ridgewood Code Chapters 149 and 154 and Building Department FAQ; Ridgewood Water; NJDEP Known Contaminated Site List (July 3, 2026 data load); NJDEP 2015 Radon Tier Assignment Report; NJDEP UST Fund FAQ; FEMA FIS 34003CV001B and OpenFEMA NFIP claims (ZIP 07450, frozen June 1, 2026); USGS gauge 01390500; NJ Infrastructure Bank. Retrieved September 7, 2026.
Section 13
Sources cited in Section 13
| # | Agency / publisher | Document | URL | Retrieved |
|---|---|---|---|---|
| 1 | Wikipedia (citing NJ Transit press releases, NRHP) | Ridgewood station | https://en.wikipedia.org/wiki/Ridgewood_station | 2026-09-07 |
| 2 | Wikipedia (citing NJ Transit) | Bergen County Line | https://en.wikipedia.org/wiki/Bergen_County_Line | 2026-09-07 |
| 3 | Wikipedia (citing NJ Transit) | Main Line (NJ Transit) | https://en.wikipedia.org/wiki/Main_Line_(NJ_Transit) | 2026-09-07 |
| 4 | NJ Transit | Ridgewood Station (station page: parking, ticket office) | https://www.njtransit.com/station/ridgewood-station | 2026-09-07 |
| 5 | Wikipedia | Ho-Ho-Kus station | https://en.wikipedia.org/wiki/Ho-Ho-Kus_station | 2026-09-07 |
| 6 | Wikipedia | Glen Rock–Main Line station | https://en.wikipedia.org/wiki/Glen_Rock%E2%80%93Main_Line_station | 2026-09-07 |
| 7 | Wikipedia | Glen Rock–Boro Hall station | https://en.wikipedia.org/wiki/Glen_Rock%E2%80%93Boro_Hall_station | 2026-09-07 |
| 8 | NJ Transit | Train Schedules service (njtransit.com/train-to), Ridgewood Station to Hoboken Terminal and to New York Penn Station and reverse, for September 10, 12 and 13, 2026, under the timetable effective August 30, 2026 (printable: MB-WKDY-083026.pdf, MB-WKND-083026.pdf) | https://www.njtransit.com/train-to?origin=Ridgewood+Station | 2026-09-09 |
| 9 | NJ Transit | Main/Bergen County/Port Jervis Lines timetable as of 3/15/26 | https://content.njtransit.com/sites/default/files/2026-03/mnbn.pdf | 2026-09-07 (URL confirmed; content not retrievable) |
| 11 | Wikipedia (citing Gateway Program documents) | Secaucus Junction | https://en.wikipedia.org/wiki/Secaucus_Junction | 2026-09-07 |
| 12 | Wikipedia (citing Amtrak/NJ Transit releases) | Portal North Bridge | https://en.wikipedia.org/wiki/Portal_North_Bridge | 2026-09-07 |
| 13 | Wikipedia (citing NJ Transit, PANYNJ) | Hoboken Terminal | https://en.wikipedia.org/wiki/Hoboken_Terminal | 2026-09-07 |
| 14 | NJ Transit | Rail Schedule Changes effective Sunday, May 31, 2026 (advisory 2100054) | https://www.njtransit.com/service-advisory/2100054 | 2026-09-07 (URL confirmed; content not retrievable) |
| 15 | New Jersey Monitor (reporting on NJ Transit board action) | NJ Transit fares increase 3% again, July 1, 2026 | https://newjerseymonitor.com/2026/07/01/nj-transit-fares-increase/ | 2026-09-07 |
| 16 | The Sun Papers (secondary, flagged) | NJ Transit Fares and Schedules: 2026 Guide | https://thesunpapers.com/lifestyle/nj-transit-fare/ | 2026-09-07 |
| 17 | NJ Transit | Rail Tickets (ticket validity rules) | https://www.njtransit.com/tickets/rail-tickets | 2026-09-07 |
| 18 | NJ Transit | Adjusted Fares (Effective July 1, 2026) and fare chart index | https://www.njtransit.com/adjustedfares ; https://www.njtransit.com/bus-fare-charts | 2026-09-07 |
| 19 | Patch Ridgewood (reporting Village bond ordinance) | 4-Story Parking Garage Coming To Downtown Ridgewood, July 18, 2018 | https://patch.com/new-jersey/ridgewood/4-story-parking-garage-coming-downtown-ridgewood | 2026-09-07 |
| 20 | Village of Ridgewood (archived site) | Hudson Street Parking Garage | https://archive.ridgewoodnj.net/index.php?option=com_content&view=article&id=3991&Itemid=1420 | 2026-09-07 |
| 21 | Village of Ridgewood | Parking | https://www.ridgewoodnj.net/213/Parking | 2026-09-07 |
| 22 | Village of Ridgewood (archived site) | Parking (2024 permit program, fees, phone, hours) | https://archive.ridgewoodnj.net/index.php?option=com_content&view=article&id=3689&Itemid=399 | 2026-09-07 |
| 23 | The Ridgewood Blog (secondary, flagged) | Why Is Ridgewood Train Station Parking So Expensive? The $1,500 Question, Jan 31, 2026 | https://theridgewoodblog.net/why-is-ridgewood-train-station-parking-so-expensive-the-1500-question/ | 2026-09-07 |
| 24 | The Ridgewood Blog (reproducing Village notice; secondary) | 2026 Ridgewood Parking Permits Now Available, Dec 28, 2025 | https://theridgewoodblog.net/2026-ridgewood-parking-permits-now-available-how-to-get-yours-at-village-hall/ | 2026-09-07 |
| 25 | Patch Ridgewood | Ridgewood Parking Permits Are Now On Sale, Dec 20, 2017 | https://patch.com/new-jersey/ridgewood/ridgewood-parking-permits-are-now-sale | 2026-09-07 |
| 26 | Village of Ridgewood Code (eCode360) | Chapter 265, Article IV Metered Parking and Permit Parking; Article V Public Parking Lots | https://ecode360.com/6695604 ; https://ecode360.com/6695667 | 2026-09-07 |
| 27 | Wikipedia | Ridgewood Bus Terminal | https://en.wikipedia.org/wiki/Ridgewood_Bus_Terminal | 2026-09-07 |
| 28 | Wikipedia (citing NJ Transit timetables) | List of NJ Transit bus routes (100–199) | https://en.wikipedia.org/wiki/List_of_NJ_Transit_bus_routes_(100–199) | 2026-09-07 |
| 29 | Wikipedia | George Washington Bridge Bus Station | https://en.wikipedia.org/wiki/George_Washington_Bridge_Bus_Station | 2026-09-07 |
| 30 | Wikipedia | Radburn station | https://en.wikipedia.org/wiki/Radburn_station | 2026-09-07 |
| — | Village of Ridgewood | Hudson Street Parking Garage opening (Nov 6, 2020), via The Ridgewood Blog, Nov 7, 2020 | https://theridgewoodblog.net/the-hudson-street-parking-garage-is-now-officially-open-on-all-levels/ | 2026-09-07 |
| — | Village of Ridgewood | 2026 Parking Permits newsflash (URL confirmed; content not retrievable) | https://www.ridgewoodnj.net/m/newsflash/Home/Detail/171 | 2026-09-07 |
| — | Village of Ridgewood | 2026 Parking Permit Application PDF (URL confirmed; content not retrievable) | https://www.ridgewoodnj.net/DocumentCenter/View/418/Application-for-Ridgewood-Parking-Permit-PDF | 2026-09-07 |
| — | Village of Ridgewood | 2026 Train Station Resident Sticker Application PDF (URL confirmed; content not retrievable) | https://www.ridgewoodnj.net/DocumentCenter/View/417/Resident-Sticker-Application-2026-PDF | 2026-09-07 |
Sources: NJ Transit, Ridgewood Station page and printable timetables (effective 8/30/26); NJ Transit, Adjusted Fares effective July 1, 2026; Village of Ridgewood, Parking page and archived parking program page; Village of Ridgewood Code, Chapter 265 Articles IV and V; New Jersey Monitor and TAPinto reporting where noted; Wikipedia station and line articles used only for structural facts (fare zones, ridership, station configuration) that cite NJ Transit source documents. Retrieved September 7 to 9, 2026. Schedule counts and fares from NJ Transit’s schedule service, September 9, 2026; 2026 permit fees other than the resident Premium permit require confirmation with the Parking Utility.
Section 14
Sources cited in Section 14
| Agency | Document | URL | Retrieved |
|---|---|---|---|
| U.S. Census Bureau | 2020 DHC P1; ACS 2020 to 2024 B25003, B25077, B19013, B25035 by tract | https://data.census.gov | 2026-09-07 |
| U.S. Census Bureau | 2020 census tract reference maps, Bergen County | https://www2.census.gov/geo/maps/DC2020/PL20/st34_nj/censustract_maps/c34003_bergen/ | 2026-09-07 |
| Bergen County / NJ Property Records | Ridgewood Village deed export, 2021 to 2026 (on file) | https://njmls.njpropertyrecords.com | 2026-09-07 |
| NJ DOE | School Performance Reports 2023 to 2024 (school addresses) | https://www.nj.gov/education/sprreports/ | 2026-09-07 |
All Census figures below were pulled from data.census.gov table downloads on September 7, 2026. ACS figures are 2020–2024 5-year estimates unless a different vintage is stated. Margins of error (90% confidence) are shown as ± where they matter.
Sources: U.S. Census Bureau, 2020 Decennial Census (DHC, table P1) and American Community Survey 2020 to 2024 five-year estimates (tables B25003, B25077, B19013, B25035) for census tracts 471 through 475, Bergen County, NJ, via data.census.gov; Bergen County deed records for Ridgewood Village, January 2021 through August 2026, as exported from NJ Property Records (2,875 recorded transfers, merged and de-duplicated; 1,730 usable residential sales, 1,297 carrying a census tract code), analysis by Ashish Desai Group; NJ Department of Education School Performance Reports (school addresses). Retrieved September 7, 2026.
Section 15
Sources cited in Section 15
- U.S. Census Bureau, Census 2000 Summary File 1, Table P001 (Total Population), Ridgewood village, NJ. https://data.census.gov/table/DECENNIALSF12000.P001?g=160XX00US3463000 . Retrieved September 7, 2026.
- U.S. Census Bureau, Census 2010 Summary File 1, Table P1, Ridgewood village. https://data.census.gov/table/DECENNIALSF12010.P1?g=160XX00US3463000 . Retrieved September 7, 2026.
- U.S. Census Bureau, 2020 Census Demographic and Housing Characteristics File, Table P1, Ridgewood village and tracts within. https://data.census.gov/table/DECENNIALDHC2020.P1?g=160XX00US3463000 and https://data.census.gov/table/DECENNIALDHC2020.P1?g=160XX00US3463000$1400000 . Retrieved September 7, 2026.
- ACS 2020–2024 5-year, B01003 Total Population, Ridgewood village, Bergen County, New Jersey. https://data.census.gov/table/ACSDT5Y2024.B01003?g=160XX00US3463000 . Retrieved September 7, 2026.
- ACS 2020–2024, B11001 Household Type. https://data.census.gov/table/ACSDT5Y2024.B11001?g=160XX00US3463000 . Retrieved September 7, 2026.
- ACS 2020–2024, B11005 Households by Presence of People Under 18 Years, Ridgewood, Bergen County, NJ. https://data.census.gov/table/ACSDT5Y2024.B11005?g=160XX00US3463000 . Retrieved September 7, 2026.
- ACS 2020–2024, B25010 Average Household Size of Occupied Housing Units by Tenure. https://data.census.gov/table/ACSDT5Y2024.B25010?g=160XX00US3463000 . Retrieved September 7, 2026.
- ACS 2020–2024, B01002 Median Age by Sex. https://data.census.gov/table/ACSDT5Y2024.B01002?g=160XX00US3463000 . Retrieved September 7, 2026.
- ACS 2020–2024, B01001 Sex by Age. https://data.census.gov/table/ACSDT5Y2024.B01001?g=160XX00US3463000 . Retrieved September 7, 2026.
- ACS 2020–2024, B19013 Median Household Income (in 2024 inflation-adjusted dollars), Ridgewood, Bergen County, NJ. https://data.census.gov/table/ACSDT5Y2024.B19013?g=160XX00US3463000 . Retrieved September 7, 2026.
- ACS 2020–2024, B25077 Median Value (Dollars), Ridgewood, Bergen County, NJ. https://data.census.gov/table/ACSDT5Y2024.B25077?g=160XX00US3463000 . Retrieved September 7, 2026.
- ACS 2019–2023, B25077 Median Value, Ridgewood. https://data.census.gov/table/ACSDT5Y2023.B25077?g=160XX00US3463000 . Retrieved September 7, 2026.
- ACS 2020–2024, B25075 Value (owner-occupied units). https://data.census.gov/table/ACSDT5Y2024.B25075?g=160XX00US3463000 . Retrieved September 7, 2026.
- ACS 2020–2024, B25003 Tenure, Ridgewood, Bergen County, NJ, and tracts. https://data.census.gov/table/ACSDT5Y2024.B25003?g=160XX00US3463000 . Retrieved September 7, 2026.
- ACS 2020–2024, B25024 Units in Structure, Ridgewood, Bergen County, NJ. https://data.census.gov/table/ACSDT5Y2024.B25024?g=160XX00US3463000 . Retrieved September 7, 2026.
- ACS 2020–2024, B25034 Year Structure Built, Ridgewood, Bergen County, NJ. https://data.census.gov/table/ACSDT5Y2024.B25034?g=160XX00US3463000 . Retrieved September 7, 2026.
- ACS 2020–2024, B25035 Median Year Structure Built, Ridgewood, Bergen County, NJ, and tracts. https://data.census.gov/table/ACSDT5Y2024.B25035?g=160XX00US3463000 . Retrieved September 7, 2026.
- ACS 2020–2024, B25002 Occupancy Status. https://data.census.gov/table/ACSDT5Y2024.B25002?g=160XX00US3463000 . Retrieved September 7, 2026.
- ACS 2020–2024, B25004 Vacancy Status. https://data.census.gov/table/ACSDT5Y2024.B25004?g=160XX00US3463000 . Retrieved September 7, 2026.
- ACS 2020–2024, B25081 Mortgage Status, Ridgewood, Bergen County, NJ. https://data.census.gov/table/ACSDT5Y2024.B25081?g=160XX00US3463000 . Retrieved September 7, 2026.
- ACS 2020–2024, B25038 Tenure by Year Householder Moved Into Unit, Ridgewood, Bergen County, NJ. https://data.census.gov/table/ACSDT5Y2024.B25038?g=160XX00US3463000 . Retrieved September 7, 2026.
- ACS 2020–2024, B25088 Median Selected Monthly Owner Costs by Mortgage Status, Ridgewood, Bergen County, NJ. https://data.census.gov/table/ACSDT5Y2024.B25088?g=160XX00US3463000 . Retrieved September 7, 2026.
- ACS 2020–2024, B25091 Mortgage Status by Selected Monthly Owner Costs as a Percentage of Household Income, Ridgewood, Bergen County, NJ. https://data.census.gov/table/ACSDT5Y2024.B25091?g=160XX00US3463000 . Retrieved September 7, 2026.
- ACS 2020–2024, B15003 Educational Attainment for the Population 25 Years and Over, Ridgewood, Bergen County, NJ. https://data.census.gov/table/ACSDT5Y2024.B15003?g=160XX00US3463000 . Retrieved September 7, 2026.
- ACS 2020–2024, B23025 Employment Status for the Population 16 Years and Over. https://data.census.gov/table/ACSDT5Y2024.B23025?g=160XX00US3463000 . Retrieved September 7, 2026.
- ACS 2020–2024, B08301 Means of Transportation to Work, Ridgewood, Bergen County, NJ. https://data.census.gov/table/ACSDT5Y2024.B08301?g=160XX00US3463000 . Retrieved September 7, 2026.
- ACS 2015–2019, B08301 Means of Transportation to Work, Ridgewood. https://data.census.gov/table/ACSDT5Y2019.B08301?g=160XX00US3463000 . Retrieved September 7, 2026.
- ACS 2020–2024, B08013 Aggregate Travel Time to Work (in Minutes) of Workers by Sex. https://data.census.gov/table/ACSDT5Y2024.B08013?g=160XX00US3463000 . Retrieved September 7, 2026.
- ACS 2020–2024, B25003 by census tract within Ridgewood village. https://data.census.gov/table/ACSDT5Y2024.B25003?g=160XX00US3463000$1400000 . Retrieved September 7, 2026.
- ACS 2020–2024, B25077 by census tract within Ridgewood village. https://data.census.gov/table/ACSDT5Y2024.B25077?g=160XX00US3463000$1400000 . Retrieved September 7, 2026.
- ACS 2020–2024, B19013 by census tract within Ridgewood village. https://data.census.gov/table/ACSDT5Y2024.B19013?g=160XX00US3463000$1400000 . Retrieved September 7, 2026.
- ACS 2020–2024, B25035 by census tract within Ridgewood village. https://data.census.gov/table/ACSDT5Y2024.B25035?g=160XX00US3463000$1400000 . Retrieved September 7, 2026.
- Wikipedia, “Ridgewood, New Jersey” (section names, station lines). https://en.wikipedia.org/wiki/Ridgewood,_New_Jersey . Retrieved September 7, 2026. Secondary; flagged.
- Wikipedia, “National Register of Historic Places listings in Ridgewood, New Jersey.” https://en.wikipedia.org/wiki/National_Register_of_Historic_Places_listings_in_Ridgewood,_New_Jersey . Retrieved September 7, 2026. Secondary; flagged.
- Wikipedia, “Ridgewood Public Schools.” https://en.wikipedia.org/wiki/Ridgewood_Public_Schools . Retrieved September 7, 2026. Secondary; flagged.
- Ridgewood Public Schools, district website. https://www.rpsnj.us/ . Retrieved September 7, 2026 (homepage only; subpages returned 404).
Technical note: data.census.gov table downloads were retrieved through the site’s JSON endpoint (https://data.census.gov/api/access/data/table?id=
<table>&g=
Sources: U.S. Census Bureau, Decennial Census 2000 (SF1), 2010 (SF1), 2020 (DHC); American Community Survey 5-year estimates 2015–2019, 2019–2023, 2020–2024, tables B01001, B01002, B01003, B08013, B08301, B11001, B11005, B15003, B19013, B23025, B25002, B25003, B25004, B25010, B25024, B25034, B25035, B25038, B25075, B25077, B25081, B25088, B25091, retrieved via data.census.gov September 7, 2026. Sale-price comparisons refer to Section 3 (NJMLS, analysis by Ashish Desai Group). PropStream fields marked† pending.
Sources: ACS B11001, B11005, B25010, B01002 [5][6][7][8].
Sources: ACS B25034, B25035 [16][17].
Sources: 2020 DHC P1 [3]; ACS B25003, B25077, B19013, B25035 by tract [29][30][31][32]. Tract 474 holds 1,053 of the Village’s 1,556 renter households (68 percent) and is the only tract with owner share below 90 percent.
Section 16
Sources cited in Section 16
| Agency | Document | URL | Retrieved |
|---|---|---|---|
| Ridgewood Water (Village of Ridgewood) | Billing Rates (Ord. 3945, 3995, 4037, 4085) | https://water.ridgewoodnj.net/billing/ | 2026-09-07 |
| Ridgewood Water | 2026 Drinking Water Quality Report | https://water.ridgewoodnj.net/wp-content/uploads/2026/06/Drinking-Water-Quality-Report-FINAL-VERSION-5.pdf | 2026-09-07 |
| Ridgewood Water | 2025 Water Quality Report | https://water.ridgewoodnj.net/wp-content/uploads/2025/07/B2775-Ridgewood-water-dept-2025_REV6.pdf | 2026-09-07 |
| Ridgewood Water | PFAS Quarterly Notices 2025 | https://water.ridgewoodnj.net/wp-content/uploads/2025/10/PFAS-QUARTERLY-NOTICES-2025.pdf | 2026-09-07 |
| Ridgewood Water | Public Notice 2Q2026 (Jul 16, 2026) | https://water.ridgewoodnj.net/wp-content/uploads/2026/07/Public-Notice-2Q2026-2-pages-final.pdf | 2026-09-07 |
| Ridgewood Water | April 2023 Public Notification | https://water.ridgewoodnj.net/wp-content/uploads/2023/04/April-Public-Notification.pdf | 2026-09-07 |
| Ridgewood Water | PFAS Q&A | https://water.ridgewoodnj.net/pfas-qa/ | 2026-09-07 |
| Ridgewood Water | Quarterly notices index | https://water.ridgewoodnj.net/quarterlynotices/ | 2026-09-07 |
| Ridgewood Water | Weekly updates archive Q2 and Q3 2025 | https://water.ridgewoodnj.net/wp-content/uploads/2025/06/RW-Weekly-Updates-Archived-2.pdf ; https://water.ridgewoodnj.net/wp-content/uploads/2025/08/ArchivedWeeklyUpdates3rdQuarter2025.pdf | 2026-09-07 |
| Ridgewood Water | Lead Service Line Replacement Program FAQ | https://leadreplacement.ridgewoodnj.net/pages/frequently-ask-questions | 2026-09-07 |
| Ridgewood Water | LSLRC1 Look-ahead June 2026 | https://water.ridgewoodnj.net/wp-content/uploads/2026/06/Look-ahead-LSLRC1-June-2026.pdf | 2026-09-07 |
| Ridgewood Water | Ordinances page | https://water.ridgewoodnj.net/ordinances/ | 2026-09-07 |
| Village of Ridgewood | Code Ch. 145 Fees (§145-4, 145-5, 145-6) | https://ecode360.com/6690240 ; https://ecode360.com/6690251 | 2026-09-07 |
| Village of Ridgewood | Code Ch. 125 Construction Codes | https://ecode360.com/6690183 | 2026-09-07 |
| Village of Ridgewood | Code Ch. 165 Art. II Waste Collection | https://ecode360.com/6690884 | 2026-09-07 |
| Village of Ridgewood | Code Ch. 238 Sewer User Rates | https://ecode360.com/6694857 | 2026-09-07 |
| Village of Ridgewood | Code Ch. 260 Tree Protection | https://ecode360.com/6695530 | 2026-09-07 |
| Village of Ridgewood | Code Ch. 269 Water, Billing and Charges | https://ecode360.com/6695996 | 2026-09-07 |
| Village of Ridgewood | Code Ch. 275 Yard Waste | https://ecode360.com/6696057 | 2026-09-07 |
| Village of Ridgewood | New Laws list (Ord. 4096–4104) | https://ecode360.com/RI1200/laws | 2026-09-07 |
| Village of Ridgewood | Ord. 4097, 4098, 4102, 4103 | https://ecode360.com/RI1200/laws/LF2731912.pdf ; LF2731913.pdf ; LF2754413.pdf ; LF2754412.pdf | 2026-09-07 |
| Village of Ridgewood (archive) | Council Work Session Minutes Dec 6, 2023 | https://archive.ridgewoodnj.net/index.php?Itemid=705&catid=79&id=4784&option=com_content&view=article | 2026-09-07 |
| Village of Ridgewood (archive) | Sanitation | https://archive.ridgewoodnj.net/index.php?option=com_content&view=article&id=3715&Itemid=1470 | 2026-09-07 |
| Village of Ridgewood (archive) | Graydon Pool (2023 schedule) | https://archive.ridgewoodnj.net/index.php?option=com_content&view=article&id=129&Itemid=217 | 2026-09-07 |
| New Jersey Infrastructure Bank | Ridgewood Village GAC Treatment | https://www.njib.gov/news/ridgewood-village-gac-treatment-695fe77ee83c4 | 2026-09-07 |
| Northwest Bergen County Utilities Authority | Home page | https://www.nbcua.com/ | 2026-09-07 |
| NJ Board of Public Utilities | 2025 BGS auction release | https://www.nj.gov/bpu/newsroom/2024/approved/20250212.html | 2026-09-07 |
| NJ Board of Public Utilities | 2026 BGS auction release and Board Order | https://www.nj.gov/bpu/newsroom/2026/approved/20260212.html ; https://www.nj.gov/bpu/pdf/boardorders/2026/20260212/2A%20ORDER%202026%20BGS%20Auction%20Results.pdf | 2026-09-07 |
| NJ Board of Public Utilities | 2026 Residential Universal Bill Credit Order | https://www.nj.gov/bpu/pdf/boardorders/2026/20260630/8O%20ORDER%202026%20Residential%20Universal%20Bill%20Credit.pdf | 2026-09-07 |
| PSE&G | BGS rate increase customer letter (Feb 2025) | https://nj.pseg.com/-/media/pseg/public-site/documents/paymentassistance/bgs-electric-rate-increase-21225.ashx | 2026-09-07 |
| NJ DCA (via Cornell LII) | N.J.A.C. 5:23-4.19 Training fees | https://www.law.cornell.edu/regulations/new-jersey/N-J-A-C-5-23-4-19 | 2026-09-07 |
| NJ Office of the Attorney General | PFAS settlement releases | https://www.njoag.gov/federal-court-approves-historic-pfas-settlements-valued-at-approximately-2-5-billion/ ; https://www.njoag.gov/ag-platkin-and-dep-commissioner-latourette-announce-historic-settlement-of-up-to-450-million-with-3m-for-statewide-pfas-contamination/ | 2026-09-07 |
| NAIC via Insurance Information Institute | Average premiums by state, 2021 | https://www.iii.org/fact-statistic/facts-statistics-homeowners-and-renters-insurance | 2026-09-07 |
| NAIC | Homeowners report for 2022 (release) | https://content.naic.org/article/naic-releases-homeowners-insurance-report-2022 | 2026-09-07 |
| News (flagged) | NorthJersey.com via AOL, Oct 2024 | https://www.aol.com/articles/ridgewood-water-begins-final-stage-081843547.html | 2026-09-07 |
| News (flagged) | The Ridgewood Blog, Jun 5 2023; Oct 9 2025; May 29 2026 | see footnotes 9, 10, 27 | 2026-09-07 |
| News (flagged) | TAPinto Ridgewood, bond ordinance | https://www.tapinto.net/towns/ridgewood/sections/government/articles/another-bond-ordinance-for-ridgewood-water-on-council-agenda | 2026-09-07 |
| News (flagged) | NJBIZ, 2026 BGS auction | https://njbiz.com/new-jersey-bgs-auction-2026-electricity-rates/ | 2026-09-07 |
Sources: Ridgewood Water (Village of Ridgewood), Billing Rates page, 2026 Drinking Water Quality Report, 2025 Water Quality Report, PFAS Quarterly Public Notices 2025 and July 16, 2026, PFAS Q&A, Lead Service Line Replacement Program FAQ and June 2026 look-ahead; Village of Ridgewood Code via ecode360 (Ch. 145, 165, 238, 260, 275) and Ordinances 4102, 4103; Village of Ridgewood archived Sanitation and Graydon Pool pages and December 6, 2023 Council minutes; New Jersey Infrastructure Bank; NJ Board of Public Utilities 2025 and 2026 BGS auction results and 2026 Residential Universal Bill Credit order; N.J.A.C. 5:23-4.19; Northwest Bergen County Utilities Authority; NAIC via Insurance Information Institute; NJ Office of the Attorney General. News accounts (TAPinto, NorthJersey.com via AOL, The Ridgewood Blog) are cited only where flagged. All retrieved September 7, 2026.
Section 17
Sources: Sections 2, 3, 5, 6, 7, 9, 10, 11, 12, 13, 14, 15 and 16 of this report, with the citations given there. As of September 7, 2026.
Section 18
Sources: New Jersey Division of Taxation; Bergen County Board of Taxation; New Jersey Department of Education; NJ Transit; FBI Crime Data Explorer; Ridgewood Water. Retrieved September 7, 2026.
Section 19
Sources: Bergen County deed records for the Village of Ridgewood, closed residential sales January 2025 through August 2026; New Jersey Multiple Listing Service, closed sales January 2025 through August 2026 (competition figures). Analysis by Ashish Desai Group. As of September 7, 2026.
Section 20
Sources: Village of Ridgewood (Parking, Recreation, Building Department, Bureau of Fire Prevention, Code Chapters 145, 165, 260 and 275); Ridgewood Water; Bergen County Board of Taxation; New Jersey Division of Taxation; NJ Transit; FEMA. As of September 7, 2026; dates should be confirmed each year with the office named.
Section 21
Sources: Sections 2, 6, 9, 12, 13, 16 and 19 of this report, with the citations given there. Mortgage figure is an illustration at an assumed rate. As of September 7, 2026.
This report was researched and written by Ashish Desai, REALTOR®, Keller Williams Town Life Realty, The Ashish Desai Real Estate Group, from public records, proprietary sales data and the author’s own analysis, with data through the dates shown. It is prepared with care, but it is a research document, not a guarantee. Figures marked † rest on sources that could not be independently confirmed; verify them with the issuing office before making decisions on them. Rates, fees, schedules and rules change; for any decision that turns on a specific number, confirm it with the Village of Ridgewood (201-670-5500), Ridgewood Public Schools (201-670-2700), Ridgewood Water (201-670-5520), the Bergen County Board of Taxation, the New Jersey Division of Taxation or NJ Transit. This report is not an appraisal, a tax opinion, legal advice or an offer of financing. Corrections are welcome at ashish@ashishdesaigroup.com and are carried in the next quarterly edition. Equal Housing Opportunity.
© 2026 Ashish Desai, The Ashish Desai Real Estate Group. All rights reserved. This report may be shared in full and unaltered for personal, non-commercial use with attribution to ashishdesaigroup.com; no part may be reproduced, excerpted or republished without written permission. Photographs remain the property of their respective owners and are credited where they appear. Keller Williams Town Life Realty, 82 N Summit Street, 2nd Floor, Tenafly, NJ 07670, 201-790-4664. Each Keller Williams office is independently owned and operated.
I’ll walk you through what any of this means for a specific house, your budget, or your tax bill. No obligation, and nothing to sign up for.