5. Inventory, Pipeline and Liquidity
Twelve houses
On August 29, 2026, there were 12 homes for sale in the entire Village of Ridgewood.
Ridgewood sells about 19 homes a month. Twelve for sale against that pace is less than three weeks of supply. A balanced market carries five to six months.
This one figure explains everything in Section 3. Prices are not rising because buyers have suddenly become more enthusiastic about Ridgewood. They are rising because there is very little to buy, and the people who want to live here compete for a dozen houses.
Inventory changes weekly. This count is a snapshot as of the date above.
Where the twelve houses are
| Price band | For sale | Median days on market | Share of what is for sale | Share of what sells |
|---|---|---|---|---|
| Under $800,000 | 3 | 8 | 25% | 9% |
| $800,000 to $1.2 million | 3 | 9 | 25% | 34% |
| $1.2 million to $1.8 million | 1 | 37 | 8% | 26% |
| $1.8 million to $2.5 million | 1 | 35 | 8% | 22% |
| $2.5 million and above | 4 | 92 | 33% | 9% |
There is one home for sale between $1.2 million and $1.8 million, in a price band that accounts for a quarter of all Ridgewood sales.
Meanwhile a third of everything for sale is above $2.5 million, a band that accounts for 9 percent of sales, and those homes have been sitting a median of 92 days. What is available is concentrated exactly where demand is thinnest.
What is under contract, and what it tells you
Twenty-one homes were under contract on the same date. Comparing them with what is still for sale shows how fast each part of the market is clearing.
| Price band | Under contract | For sale | Under contract for every home for sale |
|---|---|---|---|
| Under $800,000 | 2 | 3 | less than 1 |
| $800,000 to $1.2 million | 12 | 3 | 4 |
| $1.2 million to $1.8 million | 4 | 1 | 4 |
| $1.8 million to $2.5 million | 0 | 1 | 0 |
| $2.5 million and above | 3 | 4 | less than 1 |
Between $800,000 and $1.8 million, four homes are under contract for every one still available. That is a market clearing faster than sellers can replace it. At the top, more homes are sitting than moving.
The point for a buyer: the middle of the market is not just competitive on price, it is competitive on availability. When a home in your band comes up, it may be the only one for weeks.
One line to watch. The $1.8 million to $2.5 million band has been the fastest-moving segment in the Village, but on this date it had nothing under contract. With numbers this small, that may mean nothing. It may also be the first sign that the slowness at the very top is spreading downward. The next quarterly update will say which.
A note on the next few months of headlines
The homes under contract right now are mostly in the $800,000 to $1.2 million range, because that is where most of the activity was this summer. When they close in September and October, the Village’s reported “median sale price” will drop, probably well below the $1.46 million figure for the year so far.
That will not mean prices fell. It will mean that the homes closing in those months happen to be less expensive homes. If you see a headline this autumn saying Ridgewood prices are down, check what sold, not just the number. This report will make the same point again when it happens.
Liquidity, or how fast a house turns back into cash
Appreciation is the number buyers ask about. Liquidity is the number that matters if plans change and you need to sell.
In Ridgewood, the two are not the same. Three independent measures point the same way:
- What is for sale: homes above $2.5 million have sat a median 92 days; homes below $1.2 million, 8 to 9 days.
- What is under contract: homes above $2.5 million took a median 33 days to find a buyer; homes between $1.2 million and $1.8 million took under 8.
- What has sold: five-plus-bedroom homes sold at about 105 percent of asking; three- and four-bedroom homes at 112.5 percent.
The top of the Ridgewood market is materially slower than the middle. A $2.8 million house is a fine house. It is a slower asset, and a buyer who might need to sell within three to five years should price that in.
The mirror image is good news for a certain kind of buyer. That slowness is exactly why the top of the market negotiates. Buyers above $2.5 million have leverage that buyers at $1.3 million cannot get at any price.
Two current examples: one listing at $10 million has been on the market more than a year and recently cut its price by 20 percent. Another, at $5.2 million, is past 100 days. Neither is competing with anything. They share a municipal boundary with the rest of Ridgewood and very little else.
What happened the last time the market turned
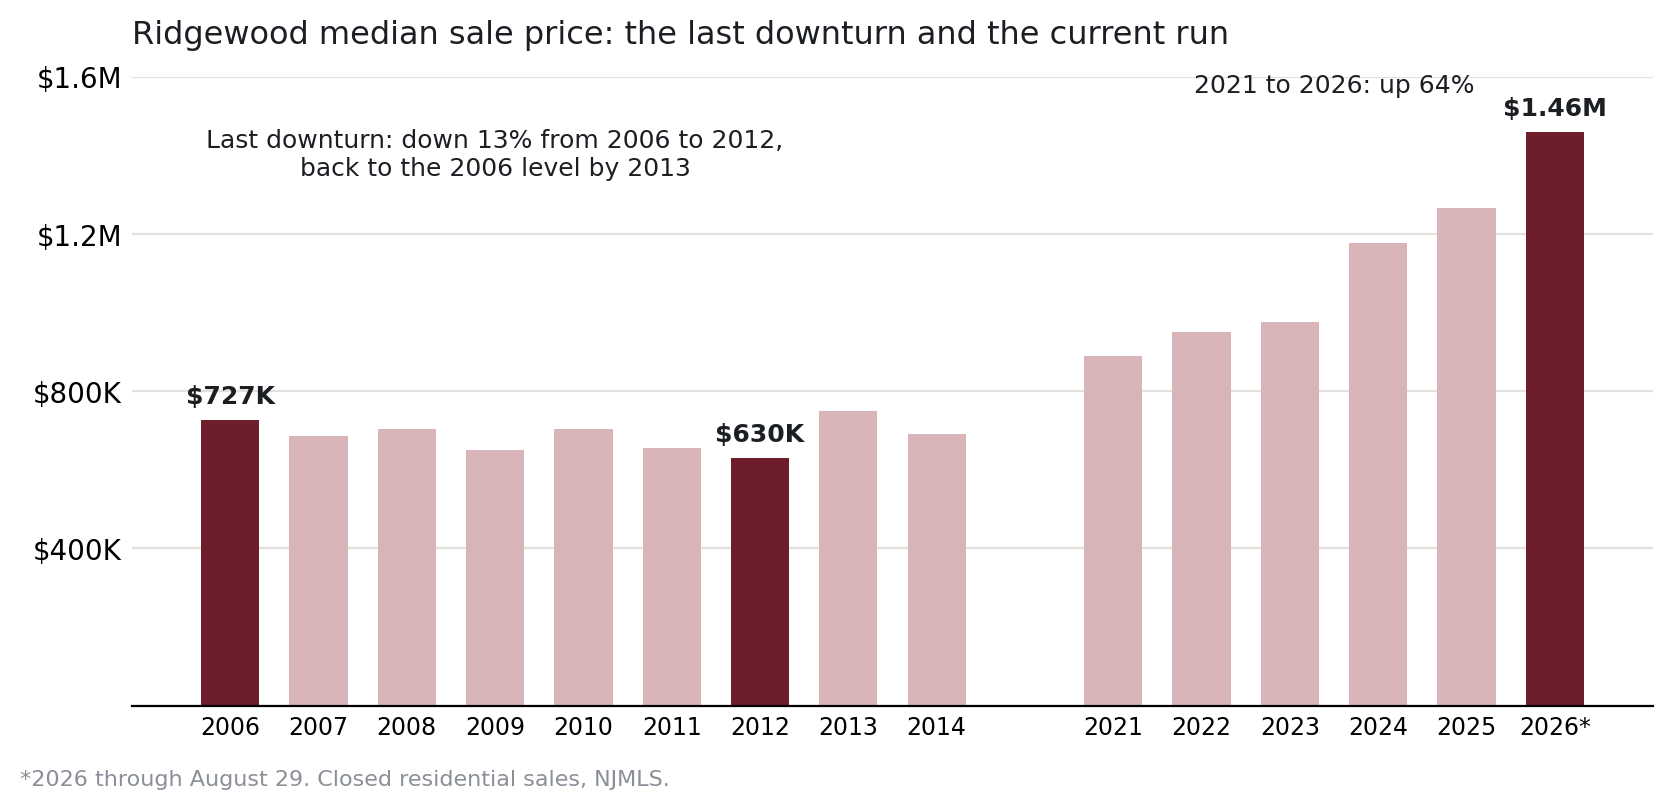
Everything above describes a rising market, because that is what the last six years contain. It would be dishonest to present that as evidence of what happens when the market falls. So here is what happened the last time it did.
| Year | Homes sold | Median sale price | Percent of asking paid | Sold above asking | Median days on market |
|---|---|---|---|---|---|
| 2006 | 286 | $727,000 | 97.7% | 17% | 48 |
| 2007 | 315 | $685,000 | 97.9% | 18% | 39 |
| 2008 | 228 | $704,500 | 96.8% | 11% | 50 |
| 2009 | 209 | $650,000 | 96.0% | 10% | 54 |
| 2010 | 264 | $705,000 | 97.3% | 16% | 36 |
| 2011 | 246 | $654,750 | 97.3% | 13% | 41 |
| 2012 | 310 | $630,000 | 97.0% | 14% | 41 |
| 2013 | 316 | $749,500 | 98.5% | 28% | 32 |
| 2014 | 298 | $690,000 | 99.2% | 31% | 28 |
Closed residential sales in the Village of Ridgewood, 2006 through 2014.
Three things stand out.
Ridgewood fell, but it did not collapse. The median sale price went from $727,000 in 2006 to $630,000 in 2012, a decline of about 13 percent over six years, and was back above the 2006 level by 2013. Year to year the median bounced around with the mix of what sold; the average sale price tells the same story more smoothly, down about 12 percent from 2006 to 2012 and within 2 percent of the 2006 level by 2013. Sales volume fell by more than a quarter, to 209 homes in 2009, before recovering.
It was a slow market, not a cheap one. Through the whole period buyers paid 96 to 98 percent of asking, one in ten to one in six homes sold above asking, and homes took five to eight weeks to go under contract. Compare that with 2026: 111 percent of asking, three in four above asking, eleven days. The 2013 figures, when the market turned up, were 98.5 percent of asking, 28 percent above asking, and 32 days. Today’s market is not a slightly stronger version of a normal one. It is a different regime.
Recovery came from the same place the current run did. Volume returned first (310 sales in 2012, 316 in 2013), then the share sold above asking doubled, then price. That is the order to watch for in reverse: if the share of homes selling above asking starts falling from 76 percent while days on market lengthen, price is the last thing to move, not the first.
What this means for a buyer today: the last time Ridgewood turned, an owner who bought at the 2006 peak and needed to sell in 2009 to 2012 took a loss of roughly 10 to 13 percent before costs, and an owner who could hold seven years did not. The buyers most exposed to any repeat are the ones who bought most recently at the largest premium to assessment, and Section 2 shows that group is large. A market that has moved 64 percent in five years on three weeks of supply has been tested once in the last twenty years, and that is how it did.
What could change this
Honest forecasting means naming what would break the pattern.
- More homes for sale. The whole dynamic rests on a dozen listings. A meaningful increase, from new construction, from normal turnover resuming, or from the 2027 revaluation prompting long-time owners to sell, changes the arithmetic quickly.
- The revaluation itself. Section 2 describes a tax reset landing in 2027. Owners facing large increases may decide to list. That is the most plausible near-term source of new supply.
- The top-end slowness spreading. The softness above $2.5 million has been stable, not spreading. If it moves down into the $1.8 million to $2.5 million band, the empty line in the table above will turn out to have been the first sign.
I’ll walk you through what any of this means for a specific house, your budget, or your tax bill. No obligation, and nothing to sign up for.