3. Market Conditions
Two terms come up throughout this report. Percent of asking is what a home sold for divided by what it was listed for; above 100 means it sold for more than the seller asked. Days on market is the time from listing to accepted offer.
Six years, one direction
| Year | Median sale price | Percent of asking paid | Sold above asking | Median days on market |
|---|---|---|---|---|
| 2021 | $890,000 | 100.8% | 56% | 12 |
| 2022 | $950,000 | 102.3% | 63% | 12 |
| 2023 | $975,000 | 105.7% | 75% | 12 |
| 2024 | $1,178,000 | 108.0% | 75% | 11 |
| 2025 | $1,265,000 | 108.9% | 80% | 12 |
| 2026 (through August) | $1,460,088 | 111.2% | 76% | 11 |
The median Ridgewood home sold for 64 percent more in 2026 than in 2021.
Two things in this table are unusual, even for Bergen County.
Buyers have paid more over asking every single year. From 100.8 percent to 111.2 percent, with no year in which Ridgewood buyers got a better deal relative to asking than the year before. That includes the period when mortgage rates more than doubled. The market did not pause.
Homes have sold in eleven or twelve days every year. The market has been at full speed since 2021. It could not go faster, so the pressure showed up in price instead.
Why: fewer sellers, not more buyers
About 355 homes changed hands in 2021. In 2024 and 2025 it was closer to 227 a year, a drop of roughly a third, while prices rose 64 percent.
If a wave of new buyers were chasing Ridgewood, sales would rise along with prices. They fell. What happened is that fewer owners chose to sell, the number of homes available shrank, and the buyers who were already here competed harder for what remained.
That distinction matters if you are trying to guess what comes next. A market driven by a surge of demand cools when the demand cools. A market driven by a shortage of listings stays this way until more owners decide to sell. Section 5 covers what might change that.
Ridgewood is three markets, not one
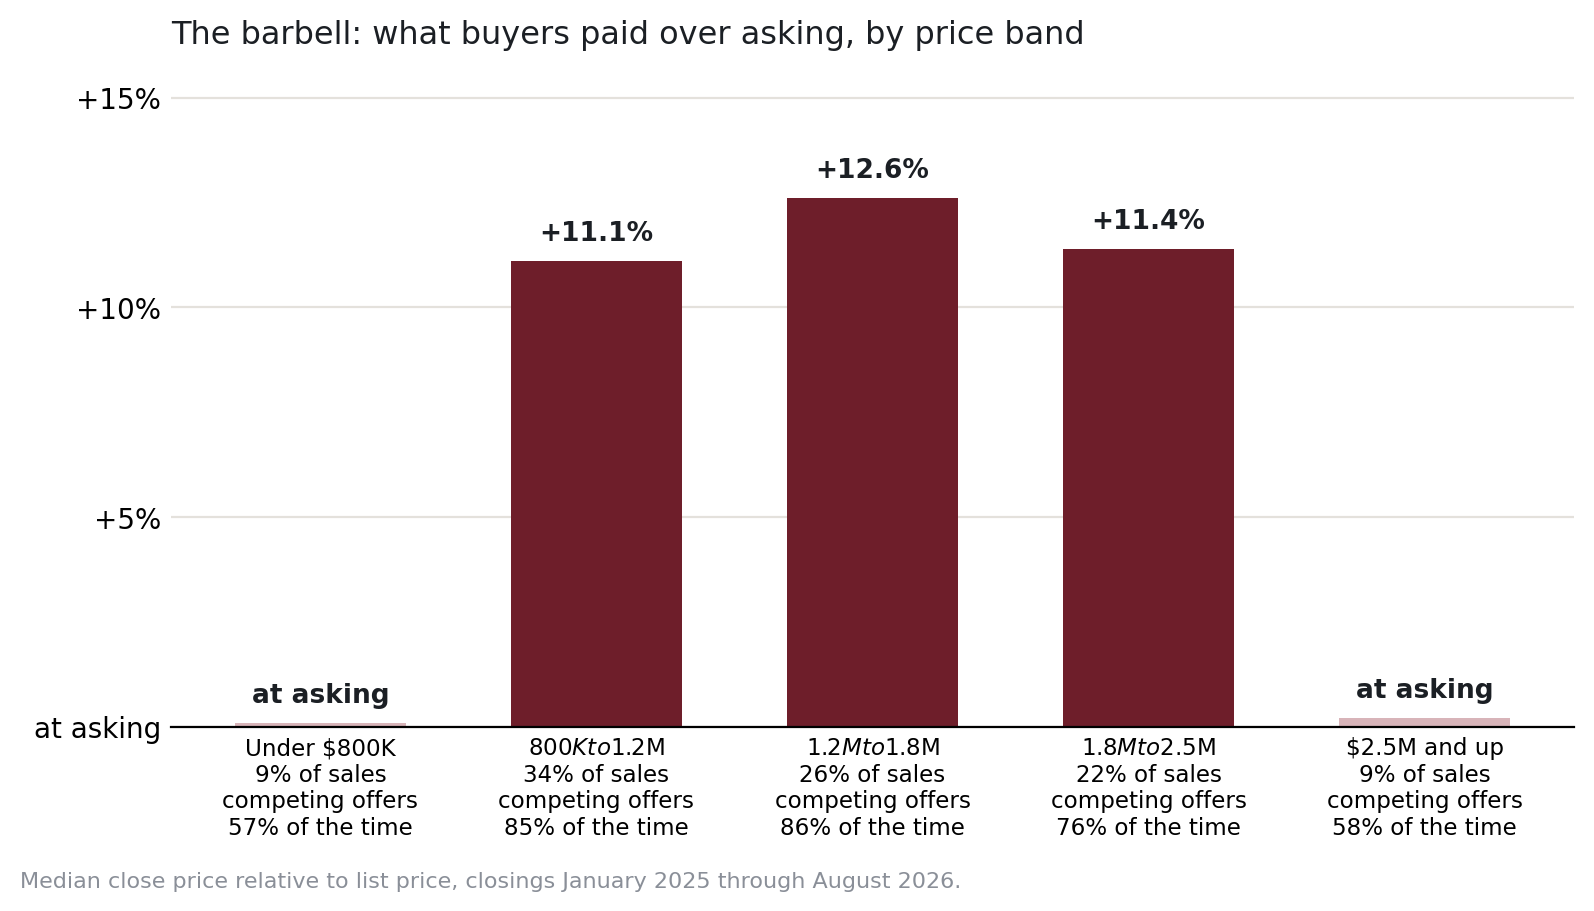
The town-wide numbers hide more than they show. Split the last twenty months of sales by price and the Village separates into three distinct markets.
| Price band | Share of sales | Percent of asking paid | Sold above asking | Median days on market |
|---|---|---|---|---|
| Under $800,000 | 9% | 100.1% | 57% | 16 |
| $800,000 to $1.2 million | 34% | 111.1% | 85% | 12 |
| $1.2 million to $1.8 million | 26% | 112.6% | 86% | 11.5 |
| $1.8 million to $2.5 million | 22% | 111.4% | 76% | 9 |
| $2.5 million and above | 9% | 100.2% | 58% | 14 |
Closings January 2025 through August 2026.
The shape is a barbell. At both ends of the market, homes sell at about asking and a buyer faces competition roughly half the time. In the middle, from $800,000 to $2.5 million, which is where 82 percent of Ridgewood homes trade, buyers pay 11 to 13 percent over asking and face competing offers on more than three out of four homes.
A buyer at $2.8 million and a buyer at $1.3 million are in different markets that share a zip code. Advice built on the town-wide average is wrong for both of them.
By bedroom count
| Bedrooms | Median sale price | Percent of asking paid | Median days on market |
|---|---|---|---|
| 3 | $975,000 | 112.5% | 11 |
| 4 | $1,300,000 | 112.5% | 12 |
| 5 or more | $2,100,000 | 104.8% | 13 |
Closings January 2025 through August 2026. Two-bedroom homes are too few to report reliably.
Three- and four-bedroom homes behave identically and are the most competitive product in the Village. Five-bedroom homes, which sit at the top of the price range, sell much closer to asking. That is the same softness at the top of the market that the barbell shows, confirmed from a second direction.
The calendar is worth real money
| Closing month | Percent of asking paid | Median days on market |
|---|---|---|
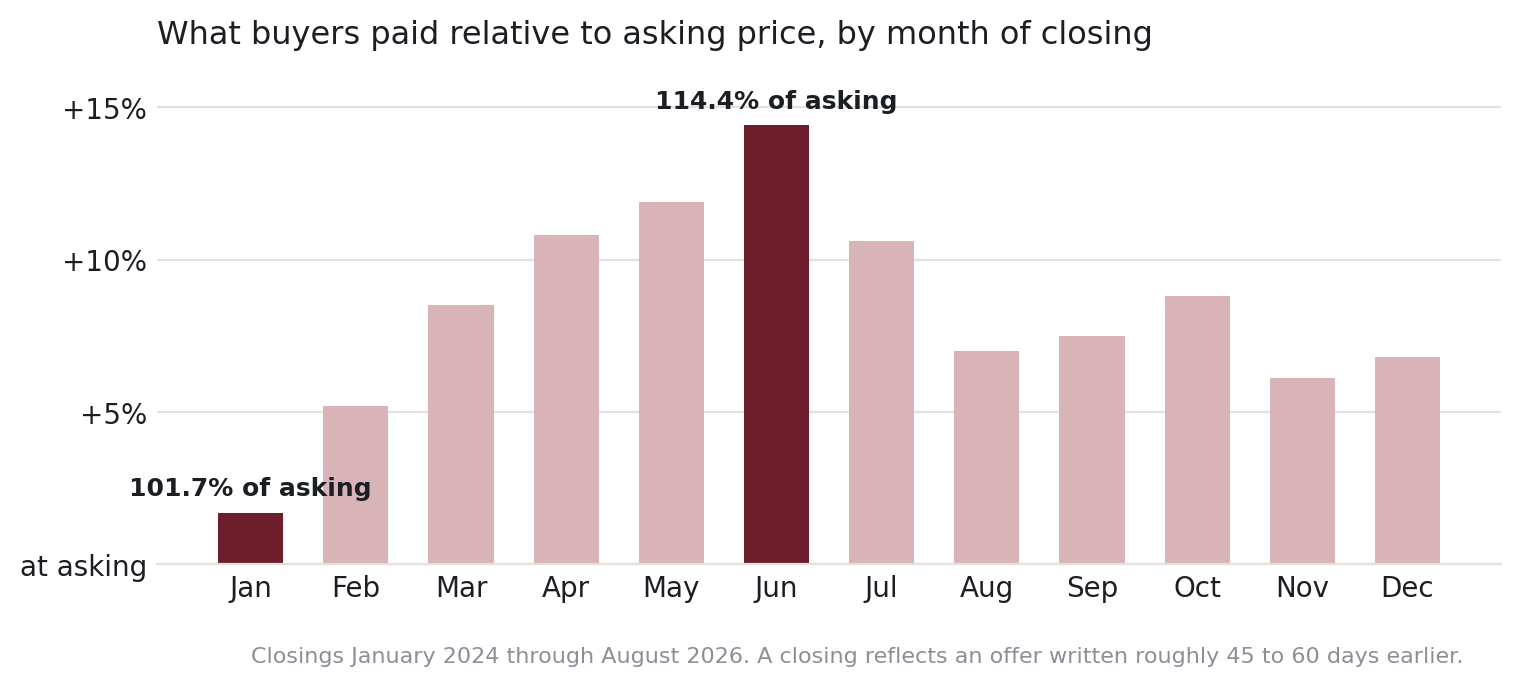
| January | 101.7% | 16.5 |
| February | 105.2% | 24.5 |
| March | 108.5% | 11.5 |
| April | 110.8% | 10 |
| May | 111.9% | 9 |
| June | 114.4% | 9.5 |
| July | 110.6% | 10 |
| August | 107.0% | 12 |
| September | 107.5% | 13.5 |
| October | 108.8% | 10 |
| November | 106.1% | 14 |
| December | 106.8% | 12 |
Closings January 2024 through August 2026.
The gap between the June peak and the January trough is 12.7 points of asking price. On a $1.2 million home, that is roughly $150,000 of difference in what buyers paid relative to asking.
One thing to keep in mind: these are closing months, and a closing reflects an offer written 45 to 60 days earlier. The June peak is April and May contract activity. Read it as: offers written in spring face the most competition; offers written in late autumn face the least.
The trade-off is choice. January and February have the fewest new listings. A winter buyer competes less and chooses from less.
For sellers: not every listing sells
The strength of this market hides one fact that matters to sellers. Since the start of 2021, about one Ridgewood listing in five did not sell: it expired or was withdrawn. Those listings carried the highest asking prices of any group, well above what actually closed. The market pays 11 percent over asking for a house priced to it; it does not rescue a house priced above it. Section 5’s figures on the top of the market are the same lesson from the other side.
What I tell my buyers: if your timing is flexible, the calendar is the cheapest negotiating tool you have. If it is not, know which month you are in and price your offer for it.
I’ll walk you through what any of this means for a specific house, your budget, or your tax bill. No obligation, and nothing to sign up for.