3. Market Conditions
Two terms come up throughout this report. Percent of asking is what a home sold for divided by what it was listed for; above 100 means it sold for more than the seller asked. Days on market is the time from listing to accepted offer.
One note on method: every "percent of asking" in this report is the sold price divided by the home's final list price, so a house that cut its price before it sold looks a little stronger here than it was. Nothing based on fewer than 10 sales is published.16
Six years, one direction
| Year | Homes sold | Median sale price | Percent of asking paid | Sold above asking | Median days on market |
|---|---|---|---|---|---|
| 2021 | 258 | $769,000 | 100.0% | 49% | 20 |
| 2022 | 234 | $834,500 | 100.0% | 43% | 18 |
| 2023 | 195 | $850,000 | 100.0% | 45% | 19 |
| 2024 | 211 | $901,000 | 100.5% | 54% | 17 |
| 2025 | 209 | $1,050,000 | 100.0% | 41% | 21 |
| 2026 (through October 2) | 171 | $1,150,000 | 100.0% | 46% | 24 |
Closed single-family sales, Borough of Paramus.16
The median Paramus house sold for 50 percent more in 2026 than in 2021.
Two things in this table are unusual.
Buyers have paid asking, not more, every single year. The median sale has landed within half a point of the list price in all six years. Between four and five homes in ten sell above asking, and that share has not trended up. Prices rose 50 percent without bidding wars becoming the norm. Sellers raised their asking prices and buyers met them.
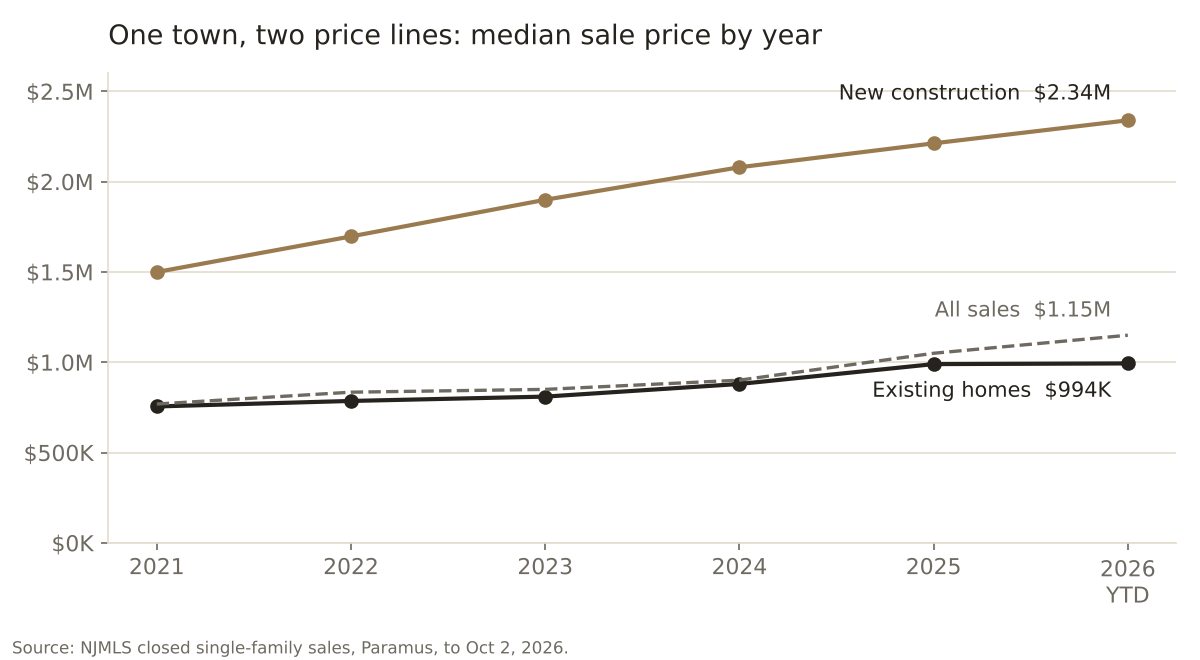
The headline number is two different things averaged together. Paramus is no longer selling the same kind of house it sold in 2021. To see that, split the sales by what was sold.
| Year | Existing homes: n | Existing homes: median | New construction: n | New construction: median | New construction share of sales |
|---|---|---|---|---|---|
| 2021 | 220 | $755,500 | 23 | $1,500,000 | 9% |
| 2022 | 198 | $786,000 | 20 | $1,697,000 | 9% |
| 2023 | 160 | $810,000 | 25 | $1,900,000 | 14% |
| 2024 | 166 | $880,000 | 26 | $2,080,000 | 14% |
| 2025 | 157 | $990,000 | 36 | $2,212,500 | 19% |
| 2026 (through October 2) | 130 | $993,750 | 30 | $2,340,000 | 19% |
Sales are matched to the 2026 tax list by address; the 87 of 1,278 with no match are left out. "New construction" is a house whose recorded year built is within two years before the sale.17
An existing Paramus house sold for about 32 percent more in 2026 than in 2021. That is a strong run by any normal standard. It is not 50 percent. The other 18 points came from a change in what is being sold: new houses on teardown lots went from one sale in eleven to one in five, at prices that climbed from $1.5 million to $2.3 million. In 2021 more than half of all Paramus sales (55 percent) closed under $800,000 and almost none closed at $2 million or more. In 2026 it is 12 percent under $800,000 and 18 percent at $2 million and up.
Notice also the last two rows. The existing-home median was $990,000 in 2025 and $993,750 in 2026. The town-wide median rose 9.5 percent over the same period. If you own an older Paramus house, the first figure is yours.
What this means for you
If you are buying or selling a 1950s to 1970s house, ignore the $1,150,000 headline. Your market is the existing-home column.
Why: fewer older homes for sale, and builders buying some of them
Paramus recorded 258 single-family sales in 2021 and 209 in 2025, a drop of about a fifth, while the median rose by more than a third over those years. As in most of Bergen County, fewer owners chose to sell.
The Paramus-specific part is underneath. Sales of existing homes fell from 220 to 157, a drop of 29 percent. Sales of new homes rose from 23 to 36. And of the 744 existing homes that sold through the MLS from 2021 through 2024, 116 (16 percent) now carry a year built later than the sale: the house that was sold is gone and a new one stands on the lot.17 (This is a listing-service count; it is a different measure from the 116 same-lot deed pairs in Section 2, and the matching number is a coincidence.) Section 2 shows that more than a third of builder purchases never reach the MLS at all, so the true share is higher.
So a buyer looking for a house under $1 million is competing for a smaller pool than six years ago, and competing in part with builders who value the same house for its lot. That is the floor under the lower end of this market. Section 2 covers the teardown economy in full; Section 5 covers what would have to change for it to ease.
There is one sign of loosening. Through October 2, 2026, 171 homes had closed, against 155 by the same date in 2025 and 142 in 2024.
Paramus is two markets with a middle
Split the last twenty months of sales by list price and the Borough separates cleanly.
| Market | Sales | Share of sales | Percent of asking paid | Sold above asking | Median days on market | New construction |
|---|---|---|---|---|---|---|
| Under $1 million (resale) | 177 | 48% | 101.2% | 57% | 18 | none |
| $1 million to $2 million (the middle) | 119 | 32% | 100.0% | 42% | 25 | 14 of 119 |
| $2 million and up (new construction) | 75 | 20% | 97.5% | 11% | 40 | 52 of 75 |
Closings February 1, 2025 through October 2, 2026.16, 17
The same sales in finer bands:
| Price band (list price) | Sales | Share of sales | Median sold | Percent of asking paid | Sold above asking | Median days on market |
|---|---|---|---|---|---|---|
| Under $800,000 | 65 | 18% | $780,000 | 103.0% | 58% | 16 |
| $800,000 to $1 million | 112 | 30% | $940,000 | 101.1% | 56% | 18 |
| $1 million to $1.5 million | 65 | 18% | $1,260,000 | 100.1% | 52% | 20 |
| $1.5 million to $2 million | 54 | 15% | $1,745,310 | 99.0% | 30% | 35 |
| $2 million and up | 75 | 20% | $2,300,000 | 97.5% | 11% | 40 |
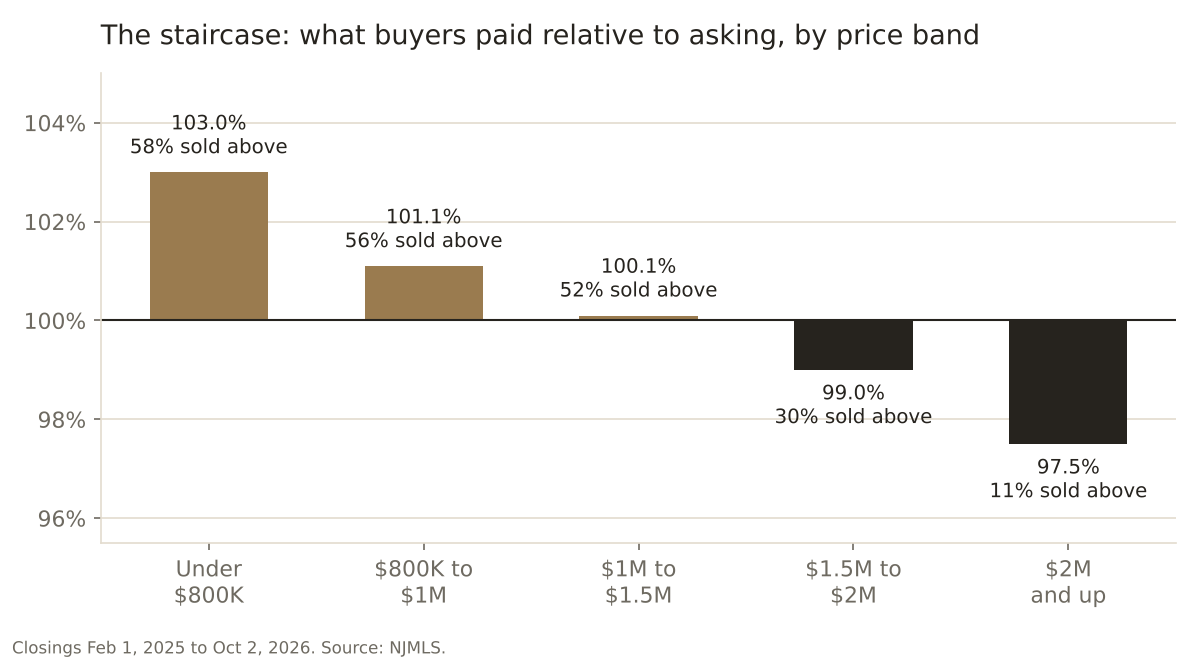
The shape is a staircase going down. Every step up in price buys a little more negotiating room and takes a little longer. Under $800,000, the median buyer paid 3 percent over asking and the house was under contract in 16 days. At $2 million and up, the median buyer paid 2.5 percent under asking, nine homes in ten sold at or below the list price, and the house took 40 days.
Under $1 million nothing sold was new. At $2 million and up, at least 52 of 75 sales were new houses. A buyer at $850,000 and a buyer at $2.3 million are shopping for different products from different sellers: one from a homeowner, the other, most of the time, from a builder. Advice built on the town-wide figure is wrong for both.
By bedroom count
| Bedrooms | Sales | Median sale price | Percent of asking paid | Sold above asking | Median days on market |
|---|---|---|---|---|---|
| 2 or fewer | 12 | $820,500 | 104.4% | 67% | 14 |
| 3 | 94 | $879,500 | 100.8% | 57% | 17 |
| 4 | 113 | $1,085,000 | 100.0% | 50% | 20 |
| 5 | 68 | $1,551,000 | 100.0% | 44% | 22 |
| 6 or more | 84 | $2,200,000 | 97.6% | 13% | 40 |
Closings February 1, 2025 through October 2, 2026.16
Six-bedroom houses are 84 of 371 sales, almost one in four. In most Bergen County towns that row would be too small to print. In Paramus it is the new-construction market seen from a second direction, and it shows the same thing the price bands do: longer on the market, sold below asking. The smallest houses are the most contested, which fits Section 2: a two- or three-bedroom house on a standard lot is the one a builder also wants.
The calendar: money under $1 million, time above it
Town-wide, the calendar barely registers.
| Closing month | Sales | Percent of asking paid | Median days on market |
|---|---|---|---|
| January | 72 | 100.0% | 20 |
| February | 49 | 100.0% | 32 |
| March | 77 | 100.0% | 18 |
| April | 88 | 100.1% | 16 |
| May | 90 | 100.1% | 18 |
| June | 109 | 100.1% | 19 |
| July | 101 | 101.0% | 16 |
| August | 117 | 100.0% | 16 |
| September | 117 | 100.0% | 21 |
| October | 98 | 99.3% | 22 |
| November | 90 | 100.0% | 27 |
| December | 99 | 100.0% | 23 |
All single-family closings, 2021 through 2025 (full years).16
The whole range is 1.7 points, from 99.3 percent in October to 101.0 percent in July. That is a small gap, and anyone who tells you there is a "right month" to buy a $1.8 million house here is not reading the data: homes listed at $1 million and up show no seasonal pattern in price (monthly medians between 96.9 and 100.0 percent). The tables below show what the calendar does change at those prices.
Under $1 million there is a real, modest effect.
| Closing month | Sales | Percent of asking paid | Sold above asking | Median days on market |
|---|---|---|---|---|
| January | 53 | 100.0% | 43% | 18 |
| February | 31 | 100.5% | 52% | 21 |
| March | 53 | 100.0% | 51% | 14 |
| April | 57 | 101.7% | 60% | 14 |
| May | 52 | 102.9% | 71% | 14 |
| June | 72 | 101.7% | 62% | 17 |
| July | 68 | 103.6% | 68% | 15 |
| August | 74 | 101.5% | 65% | 14 |
| September | 78 | 101.7% | 56% | 25 |
| October | 58 | 100.0% | 43% | 24 |
| November | 67 | 100.1% | 52% | 23 |
| December | 72 | 100.0% | 49% | 15 |
Single-family closings with a list price under $1 million, 2021 through 2025.16
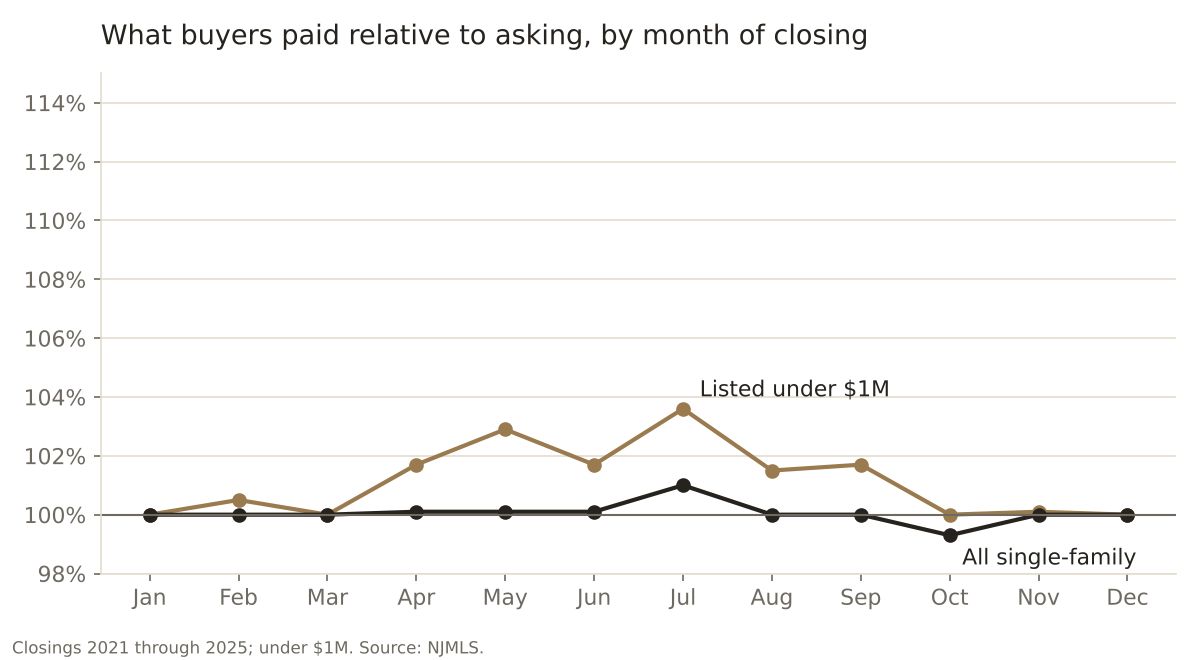
The gap between the July peak and the October-to-January floor is 3.6 points of asking price. On an $850,000 house that is roughly $30,000. The better measure is the odds of a contest: seven in ten of these homes sold above asking in May closings, four in ten in January and October closings.
These are closing months, and a closing reflects an offer written 45 to 60 days earlier. Sorting the same sales by the month the house was first shown says the same thing from the seller's side: sold homes under $1 million that came to market in February went for a median 104.6 percent of asking and in April 103.5 percent; those that came out in July or September went for 100.0 percent. Read it as: offers written from late winter through spring face the most competition; offers written from midsummer on face the least.
What this means for you
A buyer under $1 million with flexible timing gains a few points and better odds by writing offers in late summer and autumn. A seller under $1 million gains the same by coming out between February and April. Above $1 million, the month does not matter; the price and the house do.
The same calendar for the other two markets. Above $1 million the month does not move the price. It moves the time.
| Closing month | $1M to $2M: sales | Percent of asking paid | Sold above asking | Median days on market |
|---|---|---|---|---|
| January | 18 | 98.9% | 17% | 36 |
| February | 16 | 98.6% | 38% | 48 |
| March | 20 | 99.8% | 20% | 41 |
| April | 24 | 100.0% | 42% | 26 |
| May | 28 | 99.4% | 36% | 32 |
| June | 27 | 99.3% | 33% | 20 |
| July | 27 | 100.0% | 37% | 21 |
| August | 33 | 98.6% | 33% | 20 |
| September | 29 | 99.8% | 34% | 18 |
| October | 30 | 99.4% | 33% | 18 |
| November | 19 | 98.6% | 16% | 40 |
| December | 19 | 97.5% | 26% | 41 |
Single-family closings with a list price of $1 million to $2 million, 2021 through 2025.16
From $1 million to $2 million, buyers paid between 97.5 and 100 percent of asking in every month of the year. What changes is how long the house sits: about 20 days for closings from June through October, and about 40 for closings from November through March.
At $2 million and up there are too few sales in most single months to publish, so the calendar is by quarter.
| Closing quarter | $2M and up: sales | Percent of asking paid | Sold above asking | Median days on market |
|---|---|---|---|---|
| January to March | 7 | too few to publish | ||
| April to June | 27 | 98.3% | 19% | 25 |
| July to September | 26 | 96.1% | 4% | 30 |
| October to December | 22 | 95.5% | 9% | 35 |
Single-family closings with a list price of $2 million and up, 2021 through 2025.16
Almost nothing at this price closes in the first three months of the year. Spring closings came closest to asking, and the discount widened as the year went on, from under 2 percent in spring to about 4.5 percent in the last quarter.
What this means for you
Under $1 million, the month changes what you pay. From $1 million to $2 million, it changes how long you wait, so a winter buyer has more time and a winter seller should expect about twice the wait. At $2 million and up, the later in the year you buy, the more room there has been to negotiate.
If you are also looking at Ridgewood. The two towns behave differently. In Ridgewood the median house is under contract in 11 or 12 days, while a Paramus house from $800,000 to $1 million takes about 18. Ridgewood has a strong spring premium, with a gap of 12.7 points between its best and worst month for price; in Paramus the gap is 1.7 points. Ridgewood had 12 homes for sale in late August 2026, against 46 in Paramus on October 2. The Ridgewood Market Report covers that town in the same depth.
For sellers: not every listing sells
Since the start of 2021, 1,774 single-family listings in Paramus have ended one way or another. Of those, 1,278 sold and 496, or 28 percent, expired or were withdrawn. The rate is not even across the market.
| List price band | Sold | Expired | Withdrawn | Share that did not sell |
|---|---|---|---|---|
| Under $800,000 | 496 | 52 | 40 | 16% |
| $800,000 to $1 million | 319 | 35 | 40 | 19% |
| $1 million to $1.5 million | 203 | 50 | 62 | 36% |
| $1.5 million to $2 million | 146 | 47 | 58 | 42% |
| $2 million and up | 114 | 37 | 75 | 50% |
Single-family listings that closed, expired or were withdrawn, January 1, 2021 through October 2, 2026.16
At $2 million and up, a listing has been as likely to come off the market unsold as to close. The median asking price of the listings that did not sell was $1,379,000; of those that did, $875,000. A withdrawn listing is often put back under a new listing number, so this table overstates the number of houses that never sold. Section 5 measures how many came back and sold, and at what price.
What I tell my buyers: the first thing I ask is which Paramus you are shopping in. Under $1 million you are bidding against other families and sometimes a builder, and you should expect to pay asking or a little more. At $2 million and up you are usually negotiating with a builder who has carrying costs, and asking price is where the conversation starts, not where it ends. The town-wide median describes neither of you.
I’ll walk you through what any of this means for a specific house, your budget, or your tax bill. No obligation, and nothing to sign up for.