5. Inventory, Pipeline and Liquidity
Forty-six houses
On October 2, 2026, there were 46 single-family homes for sale in the Borough of Paramus.22
Paramus closed 226 single-family sales in the twelve months before that date, about 19 a month. Forty-six for sale against that pace is 2.4 months of supply. A balanced market is usually described as five to six months.
That is tight, but a Paramus buyer has something to look at every weekend. But the town-wide figure hides the same split that runs through Sections 3 and 4: under $1 million there are 11 homes for sale and 1.3 months of supply; at $2 million and up there are 18 homes and more than five months.
Inventory changes weekly. This count is a snapshot as of the date above.
Where the forty-six houses are
| Price band | For sale | Share of what is for sale | Share of what sells | Closed in the last 12 months | Months of supply |
|---|---|---|---|---|---|
| Under $800,000 | 5 | 11% | 18% | 40 | 1.5 |
| $800,000 to $1 million | 6 | 13% | 28% | 64 | 1.1 |
| $1 million to $1.5 million | 11 | 24% | 20% | 46 | 2.9 |
| $1.5 million to $2 million | 6 | 13% | 15% | 34 | 2.1 |
| $2 million and up | 18 | 39% | 19% | 42 | 5.1 |
| All single-family | 46 | 100% | 100% | 226 | 2.4 |
Active single-family listings, October 2, 2026; closings October 1, 2025 through October 2, 2026.22
Almost half of what Paramus sells is under $1 million. Less than a quarter of what is for sale is. Four homes in ten on the market are priced at $2 million and up, a band that accounts for one sale in five.
Three more things about the 46:
- The $2 million shelf is mostly builders' inventory. At least 8 of the 18 homes at $2 million and up carry a year built of 2023 or later on the tax list, and several of the rest are new houses whose tax record has not caught up.23 They have been for sale a median 41.5 days, and 5 of the 18 have been on more than 90 days.
- Most of the homes from $1 million to $1.5 million are new to the market. Seven of the 11 were listed in the second half of September, and the typical one had been for sale 9 days on October 2. These are fresh autumn listings, not homes that failed to sell.
- Ten of the 46 have cut their price as their most recent change, nine of them at $1 million and up.
What is under contract, and what it tells you
On the same date, 40 homes had an accepted offer and were waiting to close. Put those next to the homes still for sale and you can see where buyers are moving fastest. If more homes have a buyer than are left for sale, that price range is selling faster than new listings arrive.
| Price | Have a buyer, waiting to close | Still for sale | What it tells you |
|---|---|---|---|
| Under $800,000 | 4 | 5 | About even |
| $800,000 to $1 million | 14 | 6 | Selling fastest: more than 2 have a buyer for every 1 left |
| $1 million to $1.5 million | 10 | 11 | About even |
| $1.5 million to $2 million | 6 | 6 | Even |
| $2 million and up | 6 | 18 | Slowest: 3 are still for sale for every 1 with a buyer |
| All single-family | 40 | 46 | About even |
NJMLS listings on October 2, 2026. "Have a buyer" counts homes under contract or in attorney review.22
The point for a buyer: between $800,000 and $1 million, when a house that suits you comes up, it may be one of six. At $2 million and up you can make a shortlist.
One line to watch. The under-$800,000 band shows fewer homes pending than for sale. With counts this small that may mean nothing. It may also mean that what remains under $800,000 is the stock that needs the most work, which is exactly the stock a builder prices as a lot. The next quarterly update will say which.
A note on the next few months of headlines
The 40 pending homes have a median asking price of $1,187,000. Apply each price band's usual percent of asking and they should close at a median of about $1,188,000, against $1,150,000 for 2026 so far.24 So the next two months of closings should print a median at or slightly above this year's figure. That is a projection from 40 contracts, and it assumes they all close.
Two cautions about any Paramus headline.
First, the median here sits in the gap between two markets, so it moves with the mix of what closed, not only with prices:
| Quarter | Closings | Median sale price | Sold above asking |
|---|---|---|---|
| Q3 2025 | 64 | $1,100,000 | 44% |
| Q4 2025 | 55 | $1,190,000 | 27% |
| Q1 2026 | 40 | $1,035,000 | 32% |
| Q2 2026 | 59 | $1,200,000 | 56% |
| Q3 2026 | 68 | $1,177,500 | 46% |
Single-family closings by quarter.22
A 13 percent drop from one quarter to the next, followed by a 16 percent rise, is not the value of your house changing. It is a winter quarter with fewer $2 million closings in it. If you see a headline this winter saying Paramus prices fell, check what sold.
Second, the median asking price of what is for sale is $1,724,444. Consumer sites publish that figure as "median list price." It tells you what is left on the shelf, which Section 3 shows is weighted to new construction. It is not what a Paramus house costs.
Townhouses, condos and co-ops: a small, separate market
On October 2 there were 14 of these for sale, 1 in attorney review and 5 under contract, against 34 closings in the prior twelve months (26 townhouses, 6 co-ops, 2 condos).22 That is about five months of supply, but the count is small and it is really two unrelated things:
- Townhouses: 8 for sale. Five are in one new community on Paramus Road that is still selling out, and two are in a 2018 rental community now being sold unit by unit (Section 13 has both). Townhouse closings in the last twelve months had a median of $1,697,500, which is the new product, not the 2000-era townhomes.
- Co-ops: 6 for sale, all in one building, against 6 co-op closings in twelve months. Over 2021 to 2026 the co-op median was $326,250 with a median 51 days on market. It is the least expensive way to own in Paramus and the slowest to resell.
Every figure in this subsection rests on fewer than 35 sales. Treat it as a description, not a trend.
Liquidity, or how fast a house turns back into cash
Appreciation is the number buyers ask about. Liquidity is the number that matters if plans change and you need to sell.
In Paramus the two diverge by price. Four measures point the same way.
| Price band | Median days to accepted offer | A quarter took longer than | Percent of asking paid | Listings that ended without a sale, 2021 to date |
|---|---|---|---|---|
| Under $800,000 | 16 | 29 days | 103.0% | 16% |
| $800,000 to $1 million | 18 | 38 days | 101.1% | 19% |
| $1 million to $1.5 million | 20 | 39 days | 100.1% | 36% |
| $1.5 million to $2 million | 35 | 72 days | 99.0% | 42% |
| $2 million and up | 40 | 76 days | 97.5% | 50% |
Days and percent of asking: closings February 1, 2025 through October 2, 2026. Listings without a sale: all single-family listings closed, expired or withdrawn since January 1, 2021.22
By bedroom count the pattern repeats: three-bedroom homes went under contract in a median 17 days at 100.8 percent of asking; homes with six or more bedrooms took 40 days and sold at 97.6 percent.
The top of the Paramus market is materially slower than the bottom, and half its listings fail on the first try. That last column needs care, because a listing that fails is not a house that never sells. We traced every address.
- 496 single-family listings expired or were withdrawn since 2021, at 341 different addresses.
- 205 of those addresses (60 percent) later closed through the MLS. Another 27 were back on the market or under contract on October 2, 2026. The remaining 109 (32 percent) have no later sale in the MLS; some sold privately, some were rented, some owners stayed.
- Leave out the most recent year, which has not had time to play out, and 66 percent of the addresses later sold.
- The later-sold rate is about the same in every price band, 57 to 66 percent.
- The price of the second try: those 205 houses eventually sold for a median 96.2 percent of the asking price on the listing that failed, and two-thirds sold below it.25
Put plainly: a failed listing in Paramus usually means a house that was priced about 4 percent above what the market would pay, sat, came off, and came back. At $2 million and up that happens to one listing in two.
What this means if you are buying at the top
A $2.3 million new house in Paramus is a fine house. It is a slower asset than an $850,000 one, and if you might need to sell within three to five years you will be selling a no-longer-new house into a market that has 18 newer ones on the shelf. Price that in. The mirror image is the good news in Section 4: that slowness is why the top of the market negotiates.
What this means if you are selling under $1 million
Your risk is not time. More than four listings in five sell, in about two and a half weeks.
What happened the last time the market turned
Everything above describes a rising market, because that is what the last six years contain. It would be dishonest to present that as evidence of what happens when the market falls. So here is what happened the last time it did.
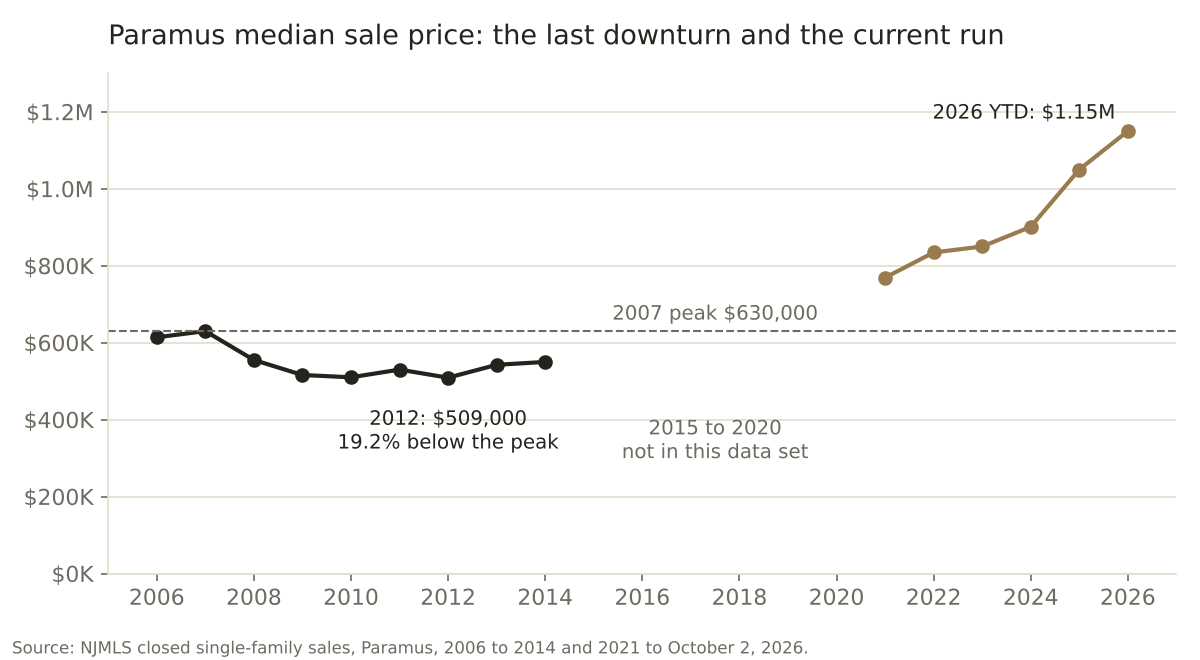
Closed single-family sales in the Borough of Paramus through NJMLS.26
Three things stand out.
Paramus fell 19.2 percent, and took years to come back. The median went from $630,000 in 2007 to $509,000 in 2012, a decline of 19.2 percent over five years. Most of it came fast: the median was down 18 percent by 2009 and then moved sideways for three years. The average sale price tells the same story, down 23 percent from 2006 to 2010. In 2014, seven years after the peak, the median was $549,950, still 13 percent below it. The sales record used here does not include 2015 through 2020, so the year Paramus regained $630,000 falls somewhere in that gap; by 2021 the median was $769,000. The recovery therefore took somewhere between eight and fourteen years.
It was a slow market, not a collapsed one. Through the whole period buyers paid 95 to 97 percent of asking, roughly one home in ten sold above asking, and homes took seven to ten weeks to go under contract. Sales fell from 202 in 2006 to 141 in 2008, a drop of 30 percent, and were back to 170 a year later. Compare 2026: 100 percent of asking, 46 percent above asking, 24 days.
Recovery showed up in speed and competition before it showed up in price. In 2013 sales jumped to 190, the share sold above asking doubled from 10 to 20 percent, and days on market fell from 45 to 28. The median rose only 6.6 percent that year. That is the order to watch for in reverse: if the share of homes selling above asking falls well below four in ten and stays there while days on market lengthen, price is the last thing to move, not the first. One soft quarter is not that signal. The fourth quarter of 2025 showed 27 percent above asking and 34 days on market, and by the second quarter of 2026 the figures were 56 percent and 20 days.
What this means for a buyer today
The last time Paramus turned, an owner who bought at the 2007 peak and had to sell between 2009 and 2012 took a loss of 16 to 19 percent before costs, and an owner who had to sell in 2014 was still down 13 percent. An owner who could hold a decade or more was made whole and then some. The 2007 market did not include today's $2 million new-construction tier, so there is no record of how that tier behaves in a downturn. The liquidity table above is the best evidence available, and it says that tier would be the slowest to sell.
What could change this
Honest forecasting means naming what would break the pattern.
- Mortgage rates. Freddie Mac's weekly survey put the average 30-year fixed rate at 7.28 percent on October 1, 2026, against 6.34 percent a year earlier.27 Paramus prices rose through that increase. The part of the market most exposed to rates is the part that borrows the most against income: the under-$1 million buyer on the demand side. A sustained fall in rates would add buyers to the band that already has 1.3 months of supply. A further rise would show first in the above-asking share, as it did in 2007, when it fell to 6 percent a year before the median moved.
- New-construction supply at $2 million and up. This is the variable that is specific to Paramus. There are 18 such homes for sale against 42 sales a year, and Section 2 shows builders are still buying roughly 40 older houses a year to replace. If the top tier slows further, two things follow: builders discount finished houses, and they pay less for the next lot. The second matters to every owner of an older house, because builder demand is part of the floor under the sub-$1 million market. Watch months of supply at $2 million and up; it was 5.1 on October 2.
- The pipeline of new units. Section 13 counts about 2,100 homes approved or under construction in Paramus. Roughly 1,500 are rental apartments at the malls and by the hospital, 332 are senior or assisted living, and 82 are for-sale townhomes. The apartments do not compete with a single-family house for a buyer, though they give a household a way to live in Paramus without buying, and the first 575 are not scheduled to open until mid-2028. The townhomes do compete: at $1.7 million to $1.9 million they are an alternative to a house in the $1.5 million to $2 million band, which is already the transition zone between the fast market and the slow one.
- More older homes for sale. Closings through October 2 were 171, up from 155 at the same point in 2025. If long-time owners continue to list at a higher rate, the under-$1 million shortage eases. It is the most benign way for this market to rebalance, and so far it is one year of evidence.
What I tell my buyers: Paramus is easy to get into and, at the top, slower to get out of. If there is any chance you will move within five years, buy the house that the next family and the next builder would both want, which is the one under $1 million on a standard lot. If you are buying the $2.3 million new house, buy it because you intend to stay, and negotiate as if you know that there are seventeen others for sale, because there are.
I’ll walk you through what any of this means for a specific house, your budget, or your tax bill. No obligation, and nothing to sign up for.